


By Debra Kumar, Assistant Professor of Practice, Iowa State University, Former Google Sr. Staff UX Researcher, Ames, Iowa, debrak@iastate.edu
Last spring, I found myself faced with a quandary: what tool should I instruct aspiring qualitative researchers to use for analyzing their qualitative data?
After more than a decade working in industry as a user experience researcher at Google, I was taking a career break of sorts and had switched gears to teaching a graduate-level course on qualitative research methods at my alma mater.
As part of a semester-long project, students had just finished conducting in-depth interviews with participants for a generative research project. Their next step was to analyze the data. I was at the point where I needed to teach and give the assignment requirements for the analysis phase.
To choose the tool I wanted them to use, I spent some time thinking about all the tools that I had used from my graduate school days and through my career.
Ultimately, I opted to have the students use a free, open-access, computer-aided qualitative data analysis software tool called Taguette. I chose it not only because it is free but also because it has the basic functionality needed to:
- Code textual data
- See all instances of a code
- Update, merge, and split codes and have them update everywhere
- Have multiple collaborators use it together to work on analysis
It also has a low learning curve—unlike some of the other computer-aided qualitative data analysis software tools, also known in short as CAQDAS tools.
In this article, I will conclude with more details on Taguette, including when Taguette may be the right tool to use and how to get started.
First, though, I want to back up for a moment and talk about:
- The goals of qualitative analysis
- Types of qualitative analysis
- What it means to “code” data
After that, I will introduce common manual approaches to coding data before ending with the benefits and drawbacks of Taguette.
The Goals and Types of Qualitative Analysis
At the highest level, the goal of qualitative data analysis is to identify and interpret patterns in the data—typically, patterns about people’s attitudes, behaviors, and perceptions—and then to make meaning of these patterns in relationship to the questions that are driving the research in the first place.
Different types of analyses can be conducted using qualitative data, including:
- Thematic analysis: a common analysis type that is focused on identifying key themes in the data (e.g., a study on shopping preferences might show that consumers care about price, quality, and brand).
- Content analysis: while similar to thematic analysis, it further explores how frequently certain themes show up in the data.
- Constant comparative analysis: the type of analysis used in grounded theory studies (an approach mostly used in academia and to develop theory of a phenomenon). Constant comparative analysis involves constructing theory by continually comparing findings from recently collected data with prior data to identify patterns and create insights.
- Discourse analysis: a form of analysis with particular focus on what meanings are held in the language that is part of the qualitative data (e.g., interviews, social media posts) as influenced by the context (e.g., the social media community and its values and beliefs).
The Role of “Coding” Your Data
No matter the analysis type, coding data is a standard and useful way to help you identify patterns that will help you bring forward the findings pertinent to your study.
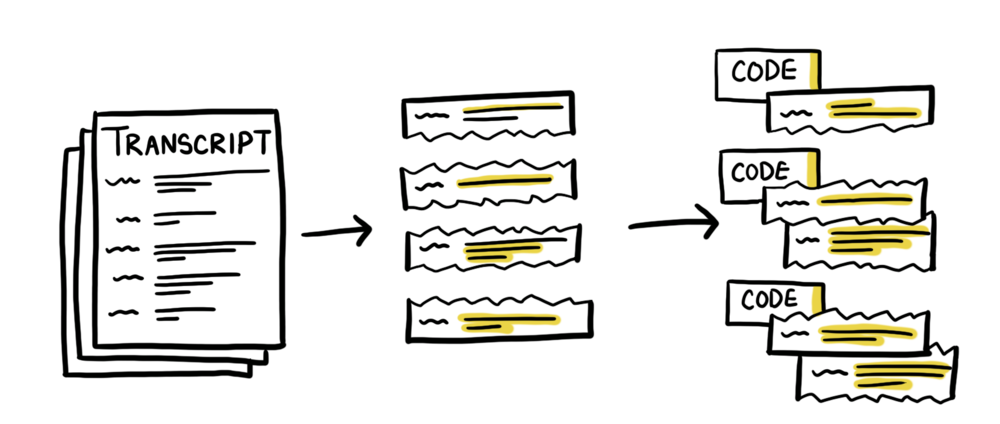
So, what exactly is “coding” in qualitative research? A researcher identifies relevant ideas, themes, words, emotions, etc., in the data and then marks them each time they occur in the data.
For instance, if conducting research on how people care for their pets, a researcher might identify the following care concepts and want to mark them each time they come up in the data: “veterinarian,” “walks,” “dog park,” “cat trees,” “toys,” “pet grandpa,” “pet insurance,” “raw food,” “snuggling.” The researcher can make “pet insurance” a code or “PI,” or “insurance.” It’s up to the researcher how to mark it. For a concept like “snuggling,” the researcher may mark any variety of expressions as “snuggling.” (e.g., “My cat and I spoon on the couch at night,” or “Bilbo and I like to share the same pillow at night.”) Coding can be approached by applying codes that were predetermined by your research questions or existing theory; this is considered a “top-down” approach to coding. (e.g., Your client wants to know not only how much snuggling with animals matters but how snuggling shows up; in this case, it would be important to consider subcodes beneath a larger “snuggling” code.)
Or, coding can be approached bottom-up by going into the data and identifying anything that seems relevant to your research questions, and creating codes to describe those segments of data. This can be relevant to clients such as when a space is new to the client, and they appreciate that they don’t know what they don’t know—but want to know what they don’t yet know.
Coded segments are then reviewed systematically to identify places where the codes could be reworded, merged, or split to better describe the data. For example, you might merge together two codes for which the themes in the coded segments are similar, or split apart a code when an important nuance between coded segments is discovered.
The next step is to start to look for patterns or themes in the data (across codes or categories of codes), and then work to build a narrative within each theme. The final step is to build a meta-narrative that links the themes together into an overall story.
Qualitative Data Analysis Tool Options
For the course I was teaching, I knew I wanted my students to learn good procedure for coding their qualitative data, but as mentioned, the challenge had been deciding what tool to use.
For high-level, there are four options:
- pen and paper
- affinity mapping
- documents/spreadsheets
- qualitative analysis software (CAQDAS)
I’ll walk through these, explaining situations in which to use each, and their benefits.
Pen and Paper
While not used by most researchers, this old-school analog option is worth mentioning—as much as anything for the pitfalls that come with it.
This method typically involves printing out transcripts or documents and then applying codes by hand with a highlighter or marker.
While this approach is free and requires no tech knowledge, it can be burdensome in the later stages of coding where a second or third pass of the data elicits the need to change the name of a code, or merge or split codes. Such updates would need to be made manually, by reading through all transcripts again to catch all instances of a code.
This approach also requires manually analyzing the codes and trying to discern the patterns of and between the codes, which can be a big brain ask and lead to missed patterns.
Bottom line: This approach is not recommended unless you are an ardent fan of analog methods!
Affinity Mapping
A second option is to create an affinity map, which involves clustering similar bits of data together in physical space. This can be done in an analog fashion with sticky notes, or—more productively—it can be approached digitally by creating digital sticky notes in a software tool such as MURAL or Miro.
Either way, the idea is the same: read through the transcripts, and write each relevant bit of data on single sticky notes. Then, group sticky notes together that represent the same concept or idea, and label them with a header. This header (itself written on a sticky note) is akin to a code for the sticky note in that group.
I used affinity mapping fairly often at Google, and it had a few benefits:
- It’s an easy way to collaboratively analyze data.
- Nonanalysts—such as product team stakeholders—can observe or even participate in the analysis.
- Digital sticky notes programs also enable team collaborations when working from different sites—whether different offices or home sites.
There are some downsides to affinity mapping though, including:
- It’s difficult to do when needing to account for a lot of data, such as many in-depth interviews. Whether analog or digital, the creation of sticky notes is highly manual and can take a lot of time and a lot of space.
- Another drawback is that the affinity notes that get created are divorced from their original context—that is, from where and how they came up in the interview. This can lead to loss of meaning (e.g., missed nuance that gives particular or richer meaning to types of moments).
Bottom line: Affinity mapping can be a fun and collaborative process, but it is not true coding and not as thorough as coding. For this reason, some argue that it doesn’t technically count as a form of qualitative data analysis.
Coding in Documents
The digital version of the pen and paper approach is to do the same highlighting and applying of codes to text segments but with digital documents. This is possible in software like Google Docs or Microsoft Word by using the comments feature to highlight a segment of text and putting your code as the comment.
A separate document or spreadsheet can serve as the codebook; in it, you list all the codes being used and what types of instances count as that code.
Unlike with paper and pen, this digital approach makes it easier to update codes as you work through the data and realize you need to merge a couple of codes or split a code into two separate codes. You can search within the document to find all instances of a particular code to update them. Collating all the transcripts together into one document makes this even easier because then you only have to search within one document. It’s also possible to easily move around the codes in the codebook to categorize them.
This is the approach I used with many of my qualitative research projects while at Google. It was fast and easy to work in documents compared to what I thought would be the learning curve of figuring out a CAQDAS tool. I could easily do my synthesis and early report outlining in the same document as the codebook to keep things all in one place.
The main downside of coding in documents is that the middle and latter stages of analysis—iterating on codes, looking for themes in the data (across codes or categories of codes), and building narratives within and across themes—is not the easiest. This is because there is no easy way to see all the coded data segments for a particular code together. I would often use a hacky solution of copying and pasting all the coded segments for each code into sections in the codebook document and do the synthesis there. But this was a very manual process.
Bottom line: Coding in documents works well enough, but as I found, better solutions exist!
Qualitative Analysis Software (CAQDAS)
I considered having students code within their research transcript documents. But I wanted to do my due diligence and understand the options when it came to computer-assisted qualitative data analysis software—CAQDAS. I had not used CAQDAS software since my own graduate school days, so I needed to refresh my knowledge and understand today’s options.
There are many CAQDAS options, some which have been around for decades. Some popular CAQDAS tools include NVivo, ATLAS.ti, Dedoose, and MAXQDA.
These tools are tailor-made for qualitative data analysis and are much more powerful than the scrappy, utilitarian, comments-in-a-document coding approach.
For example, with these CAQDAS programs, it is possible to easily see all instances of a code, which is valuable during later stages of coding when iterating on codes and identifying themes, as mentioned earlier.
But CAQDAS often comes with a price tag and a learning curve. I wanted to find something inexpensive—even free—for my students and something user-friendly for busy analysts who want to spend their time analyzing rather than learning the ropes of complex software.
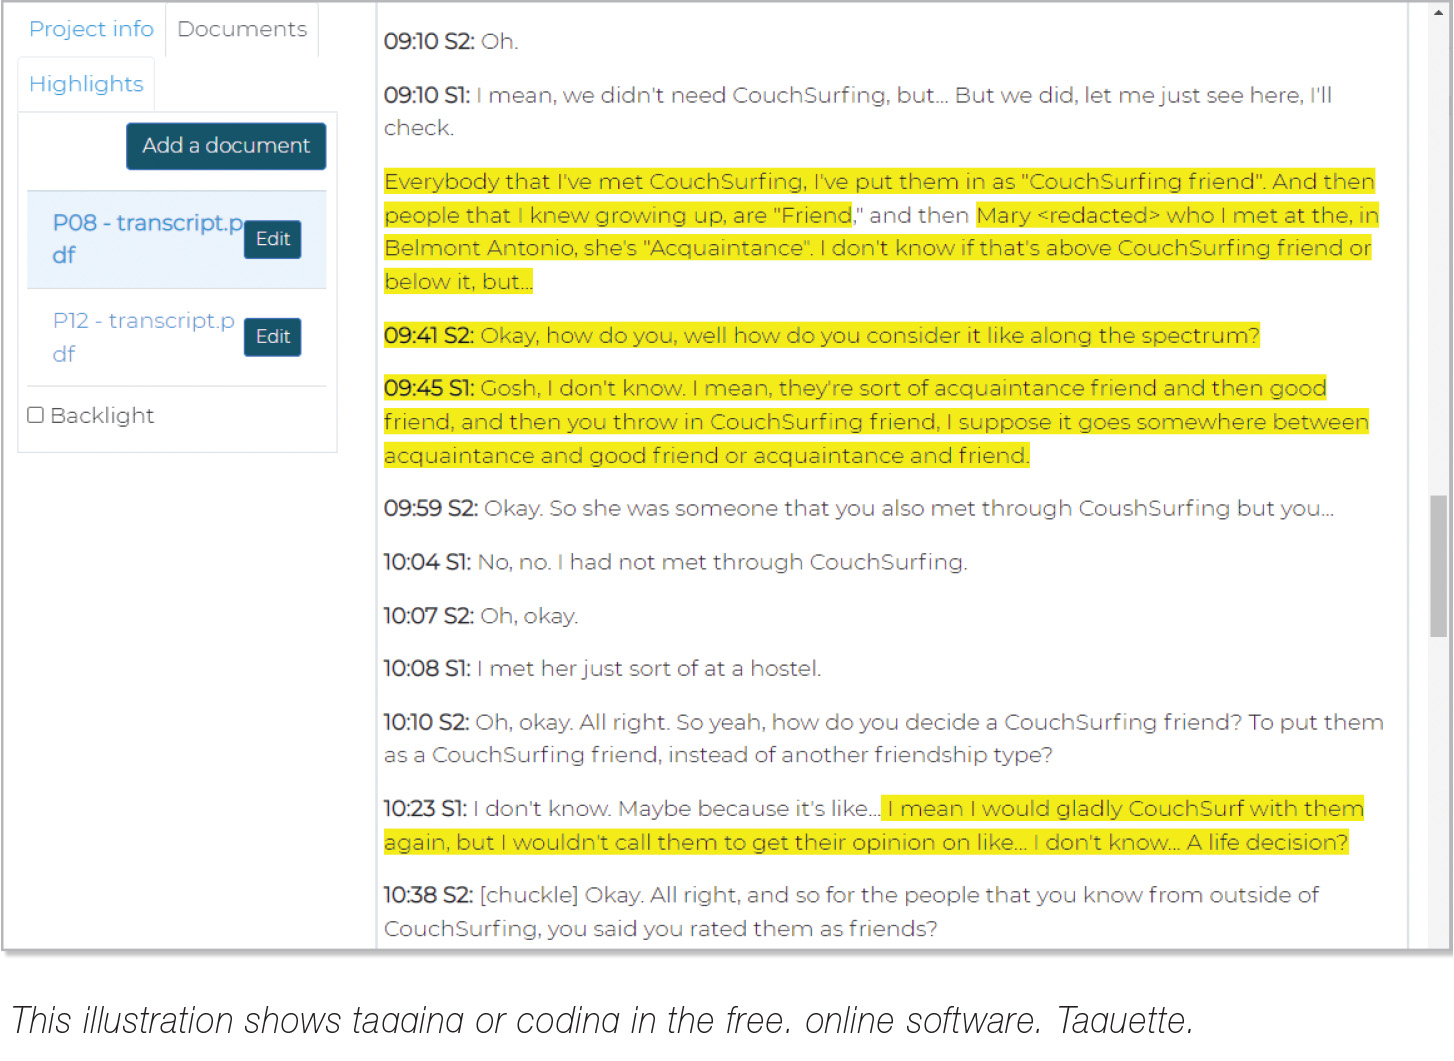
That search led me to Taguette, the free online tool that I had the students use to conduct their analyses—with success.
![]()
Taguette
Taguette is open-access software developed in 2018 by a small three-person team that wanted to create a simple, free tool for qualitative researchers.
Taguette has the functionality needed to code textual data, see all instances of a code, and update/merge/split codes and have them update everywhere. For example, for a study on how people care for their pets, the researcher might find, after reviewing all the codes they created in their initial pass of coding, that the way participants talked about caring for their pets via “walks” and “dog parks” was highly similar. So, the researcher might merge all these coded segments together into a new code of “outdoor exercise.” In Taguette, making this update is as simple as clicking “edit” on a code, then “merge,” and then renaming the code.
The software is easy to learn. I was able to figure it out myself without reading a tutorial. From reading my students’ reports, they were able to as well, even with it being their first time doing qualitative analysis and first time using CADQAS software.
Adding codes is easy—just highlight a segment of text and type in the code. All codes are listed in a sidebar and can easily be accessed.
Taguette can be installed on your own computer and run locally, or you can use the free online server at https://app.taguette.org. By running locally, researchers can ensure that clients’ confidential data is not shared on a third-party server; the data will be as secure as their computer is.
Once you have created and finished iterating on the codes for your data in Taguette, the synthesis process of building narratives to describe each theme, and a meta-narrative to describe the findings overall, would be done in a separate document.
Taguette does have a few limitations to be aware of. Only text can be coded—meaning images and videos cannot. Taguette is only for basic coding. Other CAQDAS tools may be a better fit if you desire functionality to visualize data, cluster and create connections between data sets, or do quantitative analysis on the data in addition to qualitative.
Conclusion
It’s easy to get in a routine as a researcher and rely on the same tools and approaches one has always used. But, as I found for myself, taking a bit of time to refresh my knowledge on coding approaches and relearn how to do more rigorous analysis was very helpful, and I believe made me a stronger researcher. With software tools changing so rapidly, it is important to check occasionally on what new tools are out there that might be easier and faster. If you haven’t tried qualitative analysis software before, or haven’t tried it in a while, I encourage you to try it out!