

By Robert Walker
CEO & Founder
Surveys & Forecasts, LLC
Norwalk, Connecticut
rww@safllc.com

Qualitative researchers excel at surfacing the human story, narratives, and tensions that shape a person’s perceptions of what is important and what has value. Yet, when it is time to recommend an optimal price, these softer signals are usually not enough. Defensible in-the-market pricing decisions must blend the empathy of qualitative with the structured evidence of quantitative support. This forms a “bridge” between open-ended feedback and robust quantification. Pricing is rarely a static exercise: pricing often needs to be adjusted up or down depending on competitive activity (i.e., a new entrant) or the specific markets in which the product or service must compete (i.e., higher prices in more developed countries).
This article serves as a primer on the most widely used quantitative approaches for evaluating and optimizing price—specifically, why each method exists, how you might apply it, and what the outputs mean. Most importantly, your qualitative perspective ensures that any final pricing decision remains connected to customer reality!
Price and Value: What “Worth It” Really Means
Before a pricing study begins, we must clarify what “value” means in the client’s category. In some cases, price simply reflects functionality (i.e., a higher price signals greater power, quality of construction, durability, convenience, etc.). In other situations (e.g., luxury, fashion, and high-end technology products like the latest iPhone or premium headphones), price might signal status, exclusivity, or trust. In these types of markets, higher prices can increase demand by conferring meaning, or affirming a belief system, and not just functional utility.
In the planning and design phase, keep in mind that the numbers matter only insofar as they reflect what price says to your audience about your product or service. We should always start by asking: What does price symbolize in this category? Regardless of whether price signals performance, quality, or identity, your research plan needs to go beyond willingness-to-pay questions. Foundations: Monadic and Paired Comparison Methods
Monadic and paired comparison methods are long-standing tools, rooted in experimental psychology’s early focus on isolating variables to study cause and effect. By showing respondents only one price at a time (monadic) or two side-by-side (paired), researchers can strip away extraneous influences and focus directly on price response. These methods provide fast reads on acceptance and relative sensitivity, and they have been relied upon for decades as foundational pricing tests.
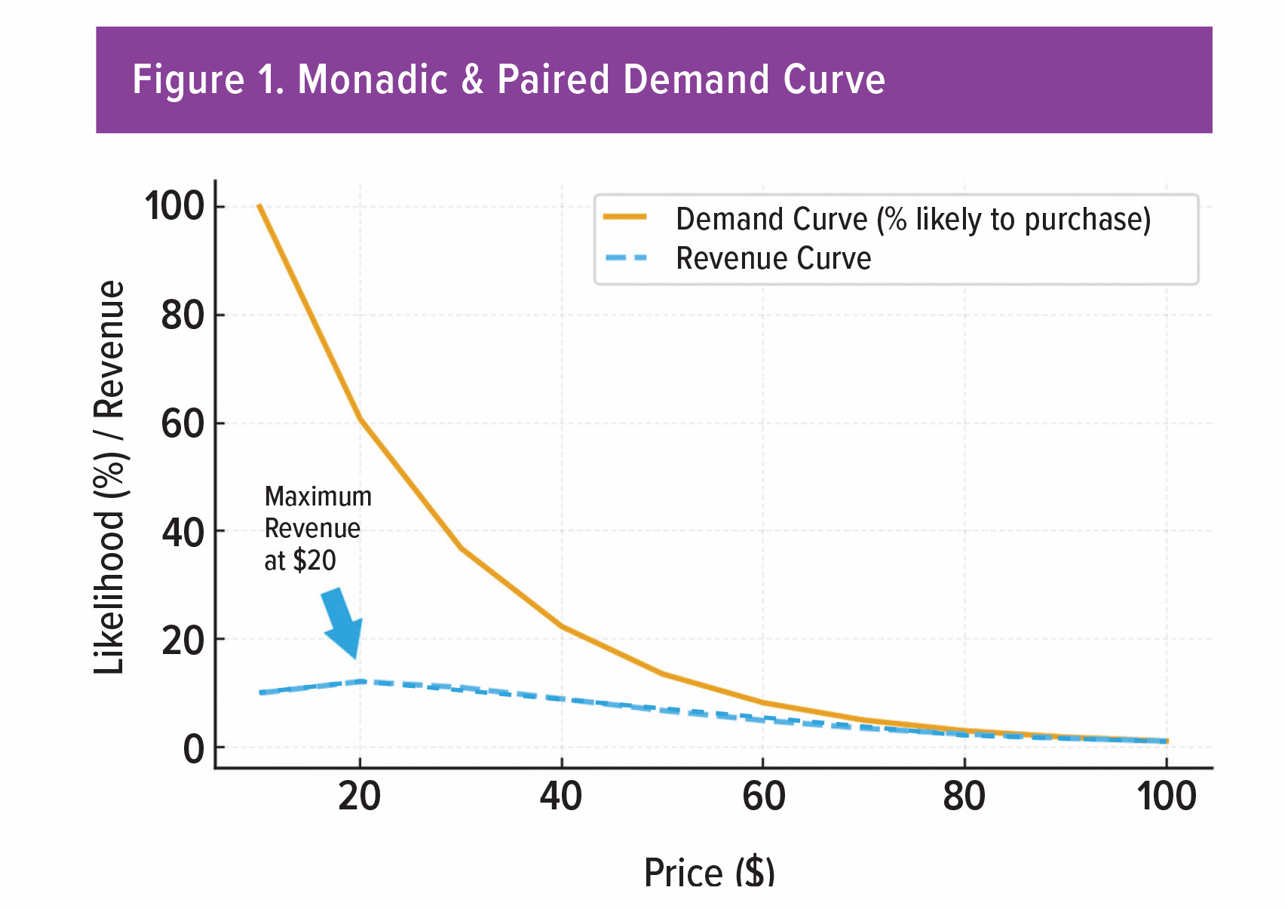
Approach: In a monadic design, each respondent is assigned a single test price and asked, “How likely are you to purchase Product X at $Y?” on a five- or seven-point purchase intent scale. In paired designs, two prices are shown (or two product propositions at different prices) and respondents are asked which is preferred.
Interpretation: We then plot the percentage who are “likely to purchase” at different price points to form a demand curve. The curve often slopes gently but then drops steeply once resistance is hit. Multiplying purchase likelihood by price yields a revenue curve showing where higher prices no longer offset volume losses. (See Figure 1.)
Highlights:
- Monadic does a reasonable job of simulating real-world exposure
- Good for quick go/no-go checks on concepts, sizes, or simple offers
- Early scoping of price boundaries prior to full product development
Caveats:
- Sample inefficiencies: as each price point requires a separate sample (i.e., 150–200 respondents per cell), study costs can ramp up quickly if testing many unique price points
- Intent does not equal sales response in the absence of competitive context
- Limited realism if features and brands matter
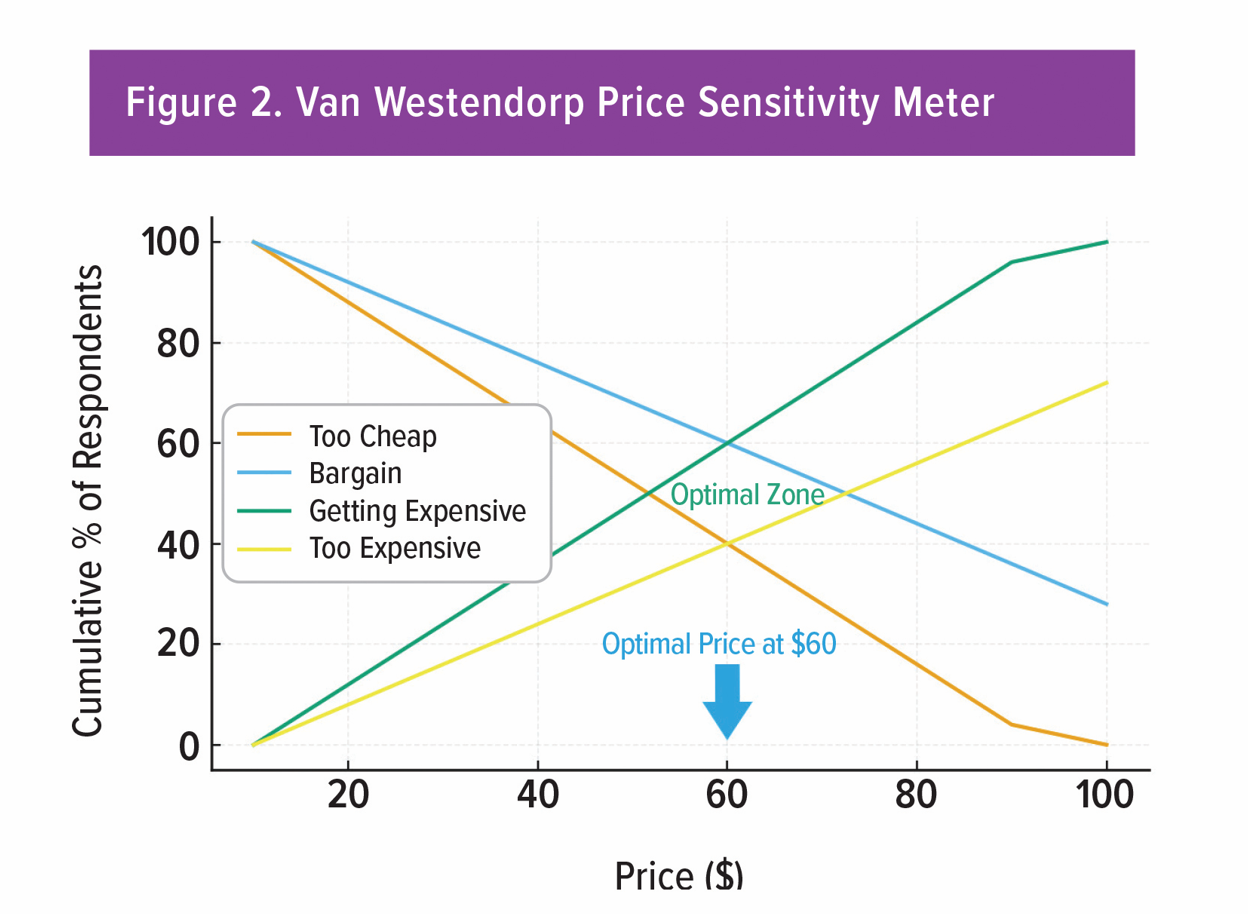
Van Westendorp Price Sensitivity Meter: Mapping Perceptual Boundaries
Developed in the 1970s by Dutch economist Peter van Westendorp, this method adapts ideas from psychology on how people perceive changes in stimuli (known as “psychophysics”) and charts subjective thresholds. This approach explores the prices that seem “too cheap,” are “a bargain,” are “getting expensive,” and become “too expensive.” Van Westendorp is especially useful for unbranded, new-to-market, or innovative offerings where perceived price acceptability is the first hurdle.
Before asking these questions, respondents are typically shown a concept. In its most basic form, this could be a simple product description (also called a “white card” concept, which is simply words on a page with or without a product image) or, in later stages, more complete positioning or advertising concepts. This ensures that price perceptions are anchored to a meaningful idea rather than an abstract item that leaves too much to the respondent’s imagination. In addition, the range of acceptable prices (i.e., from low to high) should be grounded either in relevant category price history or current competitive pricing. The price points you choose should be realistic given the economics of the product or service being tested.
Approach: Four key survey questions are needed. These are:
- At what price would you consider this product too cheap to trust its quality?
- At what price is it a bargain?
- At what price does it start to feel expensive (but you would still consider it)?
- At what price is it too expensive to buy?
Interpretation: Cumulative distributions for each question intersect to form an “acceptability window.” The lower bound warns against underpricing that undermines quality perceptions; the upper bound shows where demand will decay quickly. Narrow windows signal tight market expectations; wide windows suggest more latitude. (See Figure 2.)
Highlights:
- Finding price ranges for unfamiliar products or new formats
- Early-stage concept and product development
- Identifying optimal price points that maximize revenue
Caveats:
- Requires insight into floor and ceiling price points
- Results reflect respondent perceptions, not actual behavior
- Competitive or feature trade-offs are usually not captured
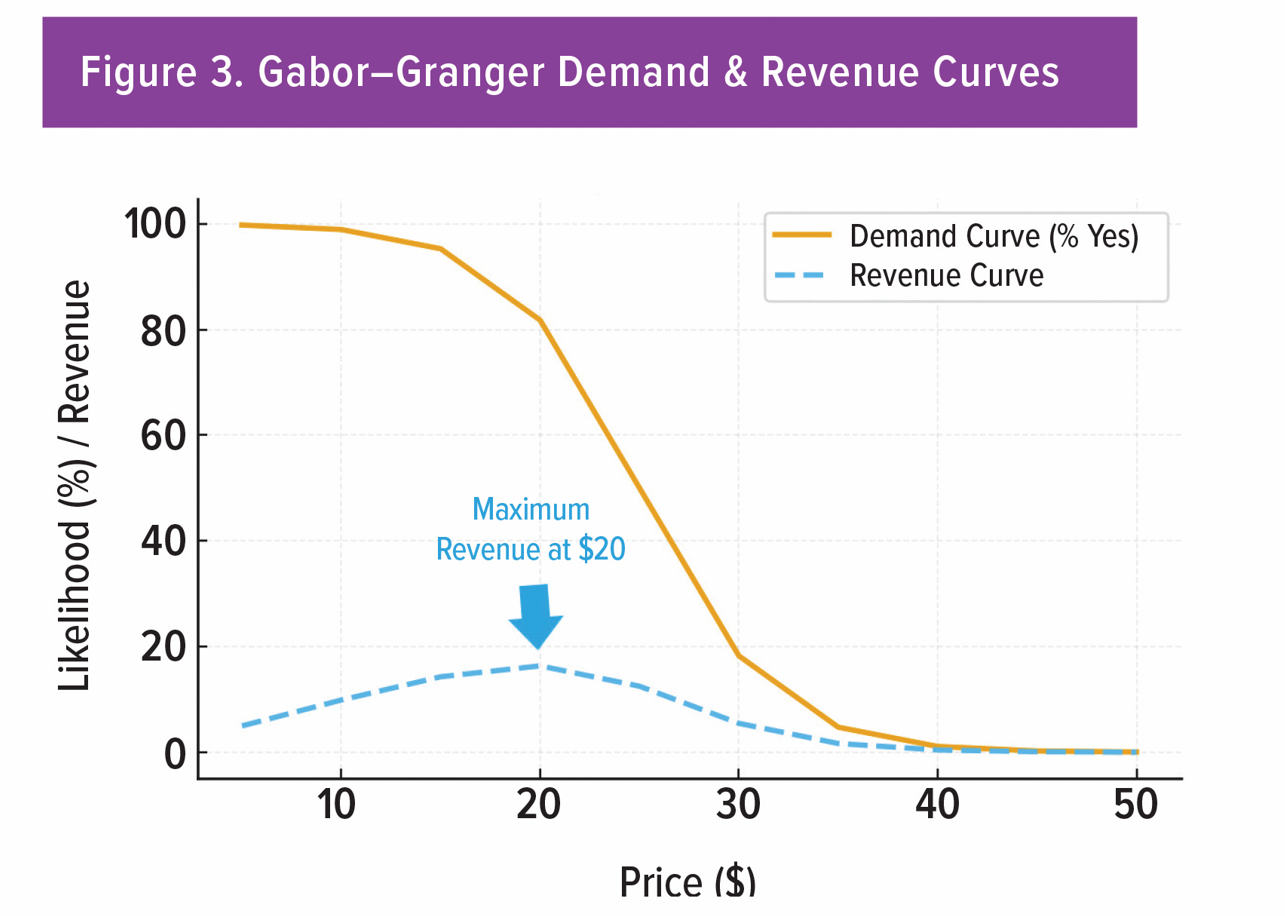
Gabor-Granger: Elasticity and Revenue in Practice
Created in the 1960s by economists André Gabor and Clive Granger, this method was designed to measure demand elasticity in a straightforward way. It captures how purchase propensity changes as price moves, enabling demand and revenue modeling for established products (e.g., consumer goods like packaged snacks or household cleaners, subscription services such as Netflix or Spotify, or SaaS tiers like different levels of Salesforce or Zoom).
Just like Van Westendorp, a concept should always be exposed prior to the pricing exercise section. This ensures that price perceptions are anchored to a concrete idea.
Approach: Respondents are shown a price and asked if they would buy. If the answer is “yes,” the respondent is shown a higher price; if “no,” we can either test a lower price or terminate. Alternatively, we can randomize prices across a larger sample and capture yes/no responses at each tested price.
Interpretation: Demand curves typically flatten at low prices and steepen as resistance is reached; sharp drop-offs indicate a danger zone. We then combine this with price to chart revenue and identify the maximizing point. We can also segment the results by needs, attitudes, or usage levels to reveal, more or less, price elastic groups. (See Figure 3.)
Highlights:
- Fine-tuning list prices, promotion thresholds, or pricing tier differentials
- Ability to size the revenue impact of small price changes (depending on how many individual price points have been selected)
Caveats:
- Binary price reactions can oversimplify reality (i.e., a simple “yes” doesn’t capture strength of conviction, e.g., someone barely willing versus enthusiastic)
- Results depend heavily on the starting price and chosen
pricing increments - Limited competitive realism
Let me now touch on something that I briefly covered in the summer issue of QRCA VIEWS: MaxDiff and Conjoint Analysis, but here, specifically, in the context of pricing research.
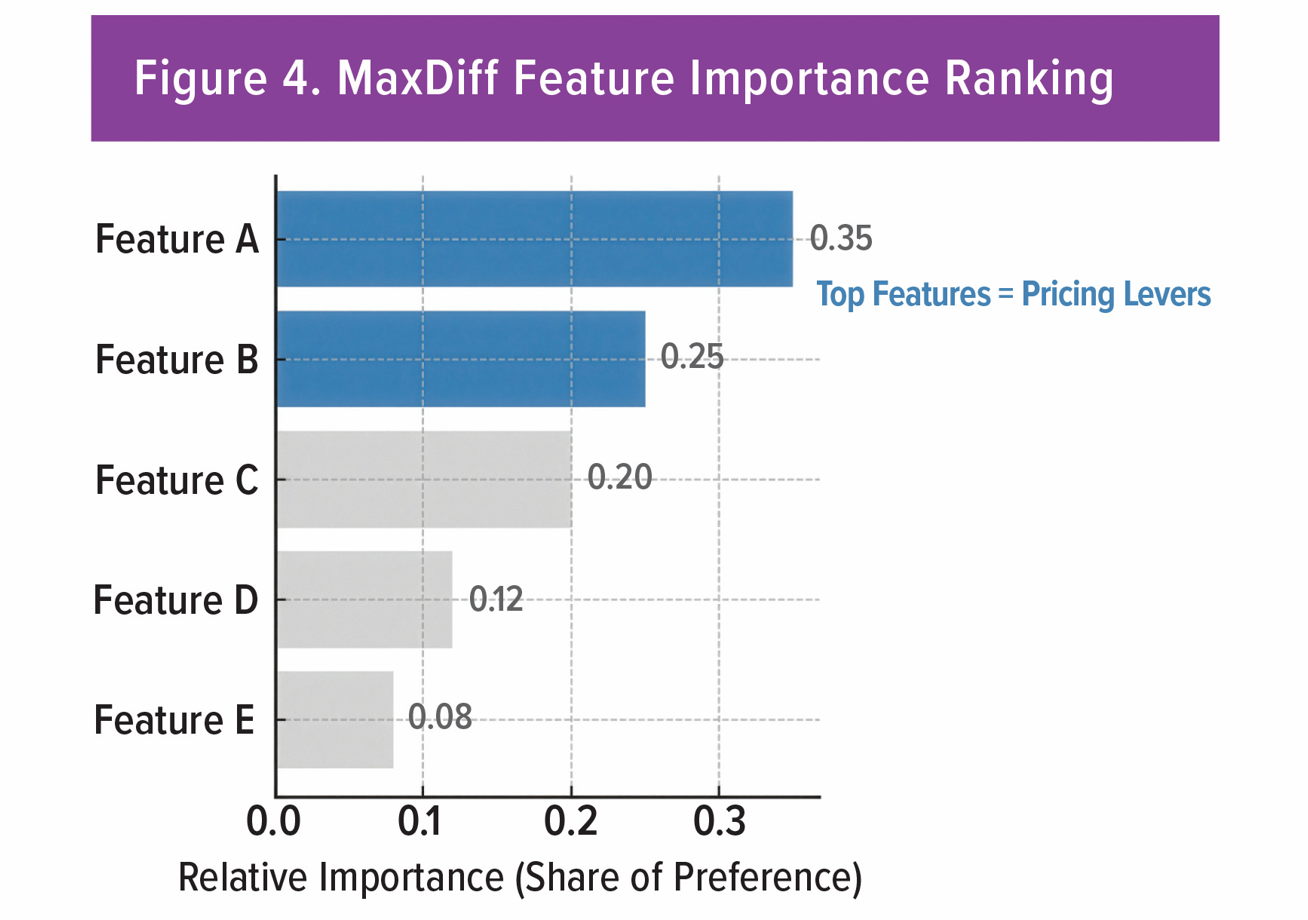
MaxDiff: Prioritizing Value Drivers
Maximum Difference Scaling (MaxDiff) was introduced in the 1980s to overcome the tendency of respondents to rate most attributes or benefits as important. It converts a long “everything is important” list into a ranking of what matters more or less to respondents (e.g., customers or a prospective target audience). For pricing, it helps to identify the features that deserve investment, differentiation, or, perhaps, even a premium.
Approach: In MaxDiff, respondents see sets of features and/or benefits. In each set of approximately four to five options, respondents pick the option that is “most” versus “least” preferred. Statistical models convert preference choices into scaled scores and then a rank-ordered hierarchy. Price becomes part of that hierarchy, and price sensitivity can be modeled off this data.
Interpretation: Top-ranked items can then become potential pricing levers. The lower-ranked items may not justify a premium or surcharge—but they may be “price of entry” items that must be provided. The hierarchy guides product design, positioning, and messaging, and guides any subsequent pricing study design. (See Figure 4.)
Highlights:
- Isolates features that are most price sensitive due to forced choice exercises
- Good for focusing resources on only those features that drive willingness to pay
- Good for designing bundles, or “good-better-best” tiers (e.g., features that are presented “table style,” such as in services, technology, or software)
Caveats:
- Preference does not equal importance (i.e., measures are relative to the options that were shown)
- May be only preliminary, in that we may need to pair these results with other choice experiments to better align with respondent behavior
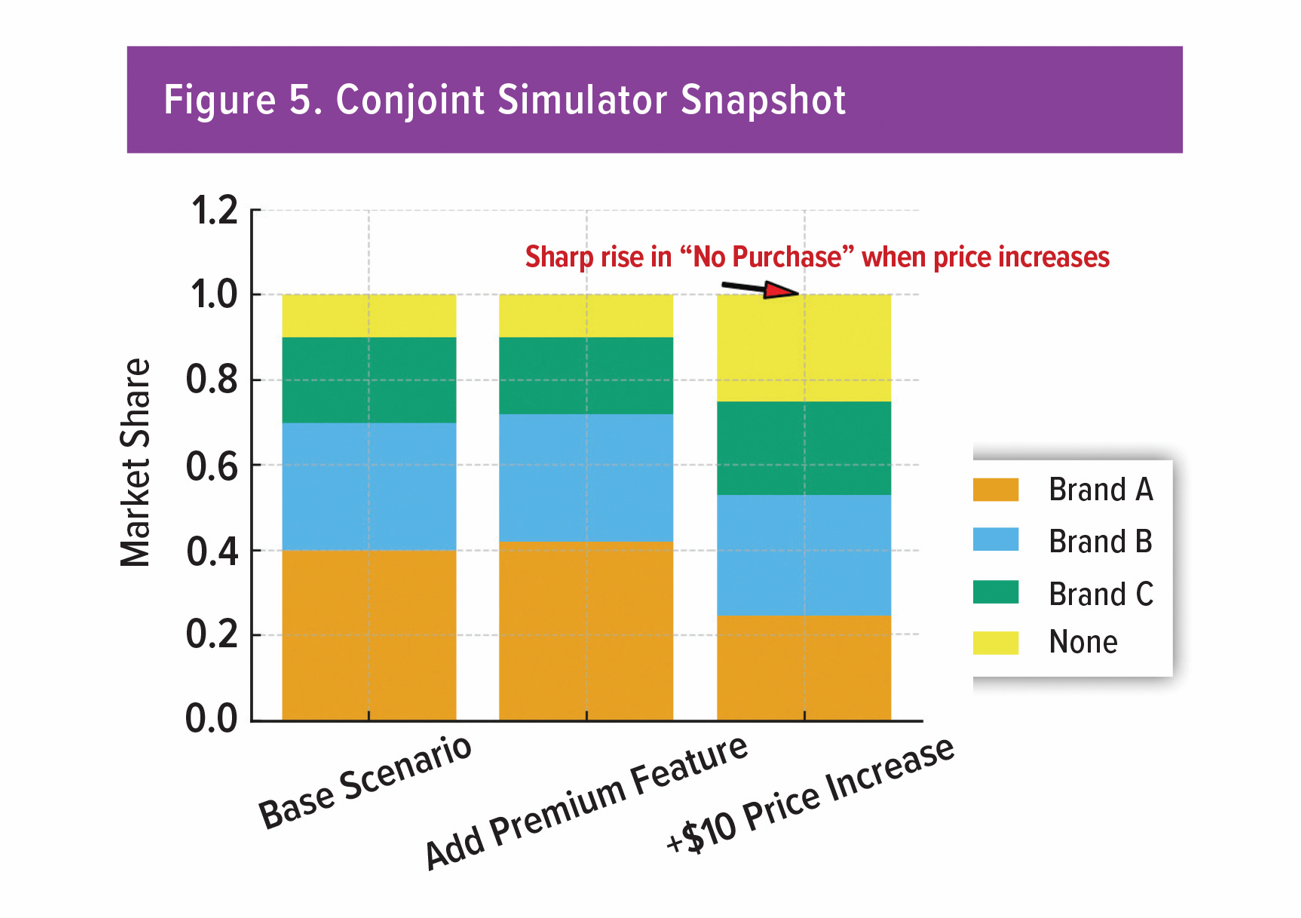
Conjoint Analysis: Mapping Real-World Trade-Offs
Conjoint analysis emerged in the 1960s and was later popularized in marketing research by Paul Green. It models how people make trade-offs among multiple attributes, including price, and is central to new product launches, portfolio optimization, and categories where differentiators matter.
A conjoint study must start with clear thinking about how price will be evaluated alongside other features. Before design, researchers should ask: Which product features are truly relevant for price trade-offs? What price ranges are credible in the market? Which competitor offerings set the context for comparison? Addressing these questions ensures that the conjoint design reflects realistic choices, making the resulting simulations useful for understanding how much price matters relative to other drivers.
Approach: Define attributes and realistic levels (informed by qualitative work and, where useful, MaxDiff). A statistical design exposes each respondent to multiple product profiles. Respondents choose or rate across profiles, mimicking real shopping trade-offs.
Interpretation: The output shows individual contributions (known as “utilities”) for each attribute level. These allow “what-if” simulations: what happens if we add a feature, raise the price, introduce a different competitor, or change messaging. Simulations estimate how changes in features or price can impact market share or volumetric demand. (See Figure 5.)
Highlights:
- Ability to set price in the context of features, competitors, or portfolios
- Ability to forecast shifts from specific configuration changes
Caveats:
- Study design and attribute framing are critical
- Unrealistic levels or jargon erode data quality
- Need to ensure price ranges and competitive sets mirror reality
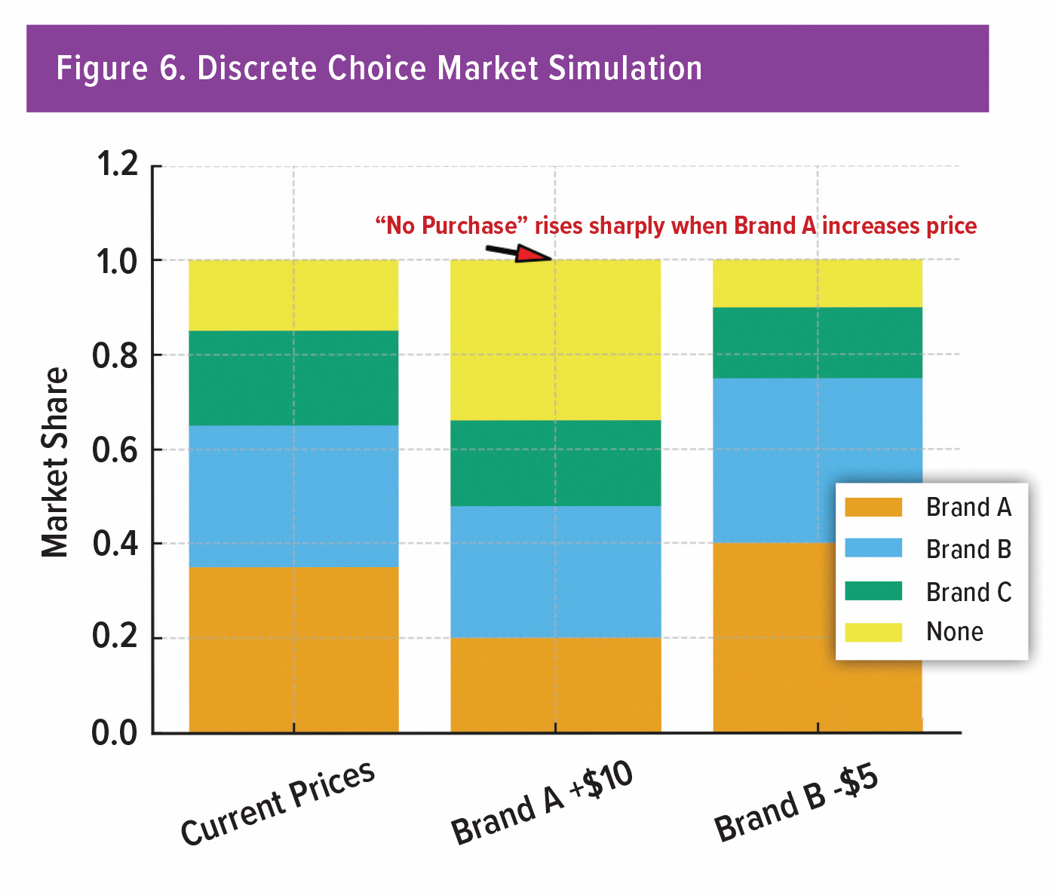
Discrete Choice: Simulating Competitive Markets
Building on Daniel McFadden’s Nobel Prize–winning work on random utility theory in the 1970s, discrete choice experiments simulate choices among competing brands or variants, including a “none” option. They extend conjoint analysis into richer, competitive contexts.
A discrete choice experiment only yields useful pricing insight if the design reflects how buyers actually weigh prices against alternatives. Before building choice sets, researchers should ask: Which competitor brands or options define the realistic context? What price ranges reflect what customers might genuinely face in the market? Which attributes meaningfully interact with price in driving choice? By grounding these elements up front, the experiment can reveal not just whether buyers will purchase, but how sensitive they are to price shifts in a competitive environment.
Approach: Construct choice sets that reflect the competitive landscape. Respondents repeatedly choose between alternatives defined by attributes and price. Efficient designs ensure coverage across combinations.
 Interpretation: Model estimates forecast how shares change as you or rivals adjust price, add features, or reposition. Rising “none” selections can reveal unmet needs or price resistance not seen in single-product tests. Qualitative follow-ups help explain the emotions or contexts behind these shifts. (See Figure 6.)
Highlights:
- Isolates the variables that are most responsive to changes in price
- Can provide precise market-level simulations for launch planning
- Good for line extensions and for defense against competitive moves
Caveats:
- Requires careful calibration of attribute levels, price ranges, and competitive sets
- Realism of the stimuli and task burden strongly affect data quality/output
 Conclusion: Combining Evidence with Empathy
Structured pricing analysis does not sideline empathy. In fact, it operationalizes it. As you move from simple acceptance checks to multi-attribute simulations, the “why” behind the numbers becomes more important. Qualitative insight shapes the attributes you test, the language you use, and how you interpret resistance, enthusiasm, or indifference.
Typically, the path to a defensible price is staged over time, though in today’s fast-moving markets, companies sometimes need to make quicker judgments. Many firms select price points based on historical norms or competitive benchmarks and hope for the best. However, if set too low, revenue is left on the table; if it is set too high, rejection and share loss become real risks.
A more deliberate process begins with exploratory qualitative work to uncover how customers define value, and the role price plays in their decisions. Early sensitivity tools, such as monadic testing, Van Westendorp, or Gabor–Granger, help establish plausible ranges and highlight points of resistance. MaxDiff identifies features that can justify a premium, while conjoint and discrete choice place price into the full context of competitors and product attributes, allowing realistic trade-off simulations.
The outcome is rarely a single “right” price, but usually a defensible range that customers will accept, with insight into how far a premium can stretch. Ultimately, pricing is both an evidence-based exercise and a managerial judgment about risk tolerance. Done well, quantitative pricing research captures the essence of customer experience while leaving ample room for qualitative exploration of products, performance, and value.