


By Robert Walker, CEO & Founder, Surveys & Forecasts, LLC, Norwalk, Connecticut, rww@safllc.com
Conjoint analysis has emerged as one of the most powerful techniques for measuring customer preferences. While conjoint analysis is squarely in the quantitative camp, this approach actually builds upon the foundational insights that qualitative researchers excel at uncovering. Through focus groups, in-depth interviews, and ethnographic studies, qualitative researchers uncover the underlying decision factors that buyers use to make purchase choices. This creates a foundation to ensure that attributes in subsequent quantitative studies are relevant and comprehensive.
We know that qualitative methods excel at revealing buyer motivations, but they can be subjective and nonnumerical. This makes it challenging to prioritize attributes for product development and predict outcomes with precision. Conjoint analysis bridges this gap by leveraging attributes identified in qualitative work into a structured approach (called an “experimental design”) that assesses the impact of different variables on an outcome, such as purchase interest. This approach clarifies qualitative findings and ensures that product development and marketing strategies are grounded in a clear understanding of preferences.
 “Conjoint” Means What Exactly?
The term “conjoint” derives from “conjoin,” or to combine, reflecting how this family of methods approaches the difficult task of isolating attribute importance. Most products exist as complex combinations of attributes (also called “factors” in conjoint designs) that consumers evaluate when bundled together with all other attributes. Conjoint analysis employs experimental designs in which attributes are systematically varied while others remain constant. In marketing, conjoint analysis is particularly powerful because it addresses a fundamental challenge: most products and services exist as complex combinations of features that consumers evaluate holistically. Conjoint analysis isolates each attribute’s contribution to overall appeal. That’s why it’s also commonly referred to as “trade-off analysis.”
When To Suggest Conjoint Analysis
Qualitative work guides us in what to measure, while conjoint analysis reveals how much each attribute matters. Conjoint analysis is a very valuable tool in these situations:
New Product Development: Conjoint identifies which feature combinations are likely to maximize market success within budget constraints.
Product Optimization: When qualitative feedback identifies multiple potential improvements, conjoint analysis prioritizes enhancements based on their impact on purchase decisions.
Brand Positioning: Conjoint quantifies how emotional connections identified through qualitative research translate to market advantage.
Market Segmentation: Conjoint identifies segments using preference patterns, letting companies develop targeted products and strategies for segments and personas.
Benefits of Using Conjoint Analysis
Conjoint analysis excels at creating choice experiences that mimic real-world buying situations. As such, it has a number of benefits that set it apart from other research approaches for evaluating ideas, notably:
- Sample-size efficiency: not all respondents need to see all possible combinations.
- Statistical robustness: multiple factors are evaluated using modest sample sizes.
- Guides product development: highlights features that deliver the greatest value.
- Identification of segments: identifies preference segments or niche opportunities.
- Simulation capabilities: predicts market share for different configurations.
- Reduces social desirability bias: realistic trade-offs are baked into the design.
Conjoint Analysis Caveats
Conjoint analysis comes with some caveats that, if ignored, could lead to a faulty conclusion.
Interaction effects: Conjoint designs assume that attributes do not significantly interact with one another, but this may not be true. For example, in smartphones, battery life and screen size may have a negative interaction (i.e., larger screens deplete battery life, despite both being desirable). We might conclude that people don’t want larger screens, but in reality, they do—they just value battery life more.
Price effects: Respondents may react differently to price in hypothetical scenarios. Respondents can underweight price or see price as a proxy for quality (especially if there are complex options). A more expensive laptop is presumed to have a faster processor, more memory, and more storage, and thus those configurations may get higher ratings.
Cognitive load: If respondents face overly complicated choice tasks, response quality can deteriorate as mental fatigue sets in. Respondents may employ simplification strategies, like fixating on price while ignoring other attributes. In a design that includes a dozen attributes, respondents might avoid the mental work needed to determine if a product is truly optimal.
A Typical Conjoint Research Process
For qualitative researchers venturing into conjoint analysis, the transition from exploratory insights to quantitative preference measurement can seem daunting. Here are the key steps you should know:
Identify Attributes and Levels: “Attributes” are the primary dimensions of your test, such as size, quantity, or price. Attributes can also be descriptive (or “nominal”), such as a brand name. “Levels” are the choices within an attribute you want to include in your design, such as linear price points (i.e., $9.99, $14.99, or $19.99) or linear sizes (8 oz, 10 oz, or 12 oz). Levels can also be “discrete,” in which some features are either included or excluded (e.g., leather versus cloth seats, an extended warranty versus not, or a credit card with cash back versus not). Leverage your qualitative insights to identify attributes that matter most to consumers and to define levels that truly represent meaningful differences.
Create Choice Tasks: Develop an experimental design that balances statistical efficiency with a realistic and nontaxing respondent experience.
Conduct Your Survey: Recruit a sample that reflects your target, using screening criteria informed by qualitative research and a sample size with good precision (i.e., 300-plus respondents for basic designs).
Analyze and Interpret: Calculate utilities and importance values and build simulations. From this, you will identify what is more (or less) important to the consumer. Connect your quantitative findings with your qualitative insights (e.g., proposed segments or personas).
Actionable Insights: Develop compelling stories and visualizations blending qualitative quotes and frame recommendations in business-relevant terms. Remember, the entire purpose of conjoint analysis is to identify an optimal product configuration that can be launched into the market.
 Common Conjoint Methodologies
Conjoint designs share a fundamental goal of quantifying consumer preferences through trade-off decisions. Knowing when to use these methodological variations will help qualitative researchers recommend the most appropriate design.
Traditional “Full-Profile” Conjoint
Historically, full-profile conjoint analysis was the first modern approach, and excels at measuring fine differences in preference. It works well when qualitative research indicates that consumers evaluate products holistically. Mechanically, respondents sequentially rate or rank complete product profiles. Balanced designs are used to isolate the main effect of each attribute. This approach is an excellent choice for products with a limited number of factors or levels.
Choice-Based Conjoint (CBC)
The most widely used conjoint methodology, CBC, simulates real-world shopping experiences by expressing a preferred option from sets of complete product profiles. Each respondent typically evaluates eight to 10 choice sets, with each set presenting three to five product options (and often with a “none” option). CBC excels at predicting market share and when consumers make discrete choices among alternatives, such as selecting a smartphone, credit card, or streaming services.
Adaptive Conjoint Analysis (ACA)
This approach iteratively customizes the choice experience for each respondent based on their previous answers. Respondents rate the importance of attribute differences, and the process evolves into more complex trade-off questions. ACA is ideal when dealing with many attributes and is particularly useful when exploring new product categories or when evaluative dimensions are not fully understood.
Menu-Based Conjoint (MBC)
MBC allows respondents to “build” their ideal product by selecting features from a menu. It is effective for products where consumers need to customize purchases, such as computers, vehicles, or services with many add-on options. MBC excels at optimizing product bundles and pricing strategies for optional features.
MaxDiff (Maximum Difference Scaling)
MaxDiff is a very specialized conjoint-type approach for measuring relative importance. This approach forces discrimination between items: it prevents the “everything is important” problem when using rating scales. This approach is ideal for prioritizing features, messaging elements, or benefits.

Interpreting Conjoint Analysis Output
The amount of conjoint output can sometimes be large, but the primary outputs from conjoint analysis boil down to these three things:
- Utility scores (technical name: “part-worths”) are the fundamental unit of measurement in conjoint analysis, quantifying consumer preferences for each attribute (factor) in a standardized way that allows for comparison. Without these values, no other conjoint outputs can be calculated.
- Importance ratings are the conversion of utility data into a more accessible form and translate more complex utility scores into straightforward prioritization guidance. Importance is calibrated to sum to 100%, making prioritization easier.
- Market simulation involves taking the mathematical models built from utilities and applying them to predict real-world market scenarios. This is typically where the greatest business value is realized, as it transforms abstract preference data into concrete market predictions.
While there are other outputs that can be derived (like willingness to pay calculations, segmentation analysis, or optimization algorithms), these three represent the core foundation of what makes conjoint analysis valuable for business decision-making.
Case Study: Paint Sprayer
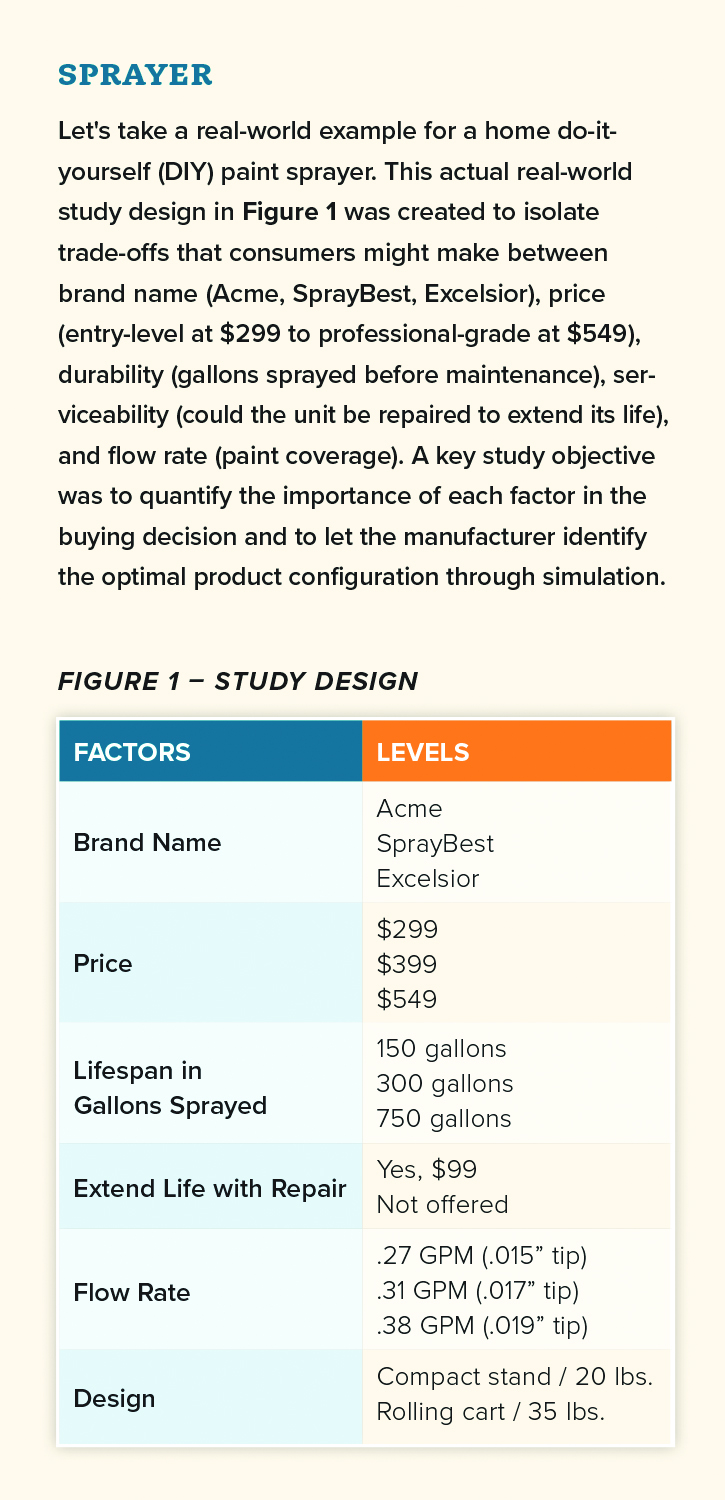
Let’s take a real-world example for a home do-it-yourself (DIY) paint sprayer. This actual real-world study design in Figure 1 was created to isolate trade-offs that consumers might make between brand name (Acme, SprayBest, Excelsior), price (entry-level at $299 to professional-grade at $549), durability (gallons sprayed before maintenance), serviceability (could the unit be repaired to extend its life), and flow rate (paint coverage). A key study objective was to quantify the importance of each factor in the buying decision and to let the manufacturer identify the optimal product configuration through simulation.
Exposure Plan
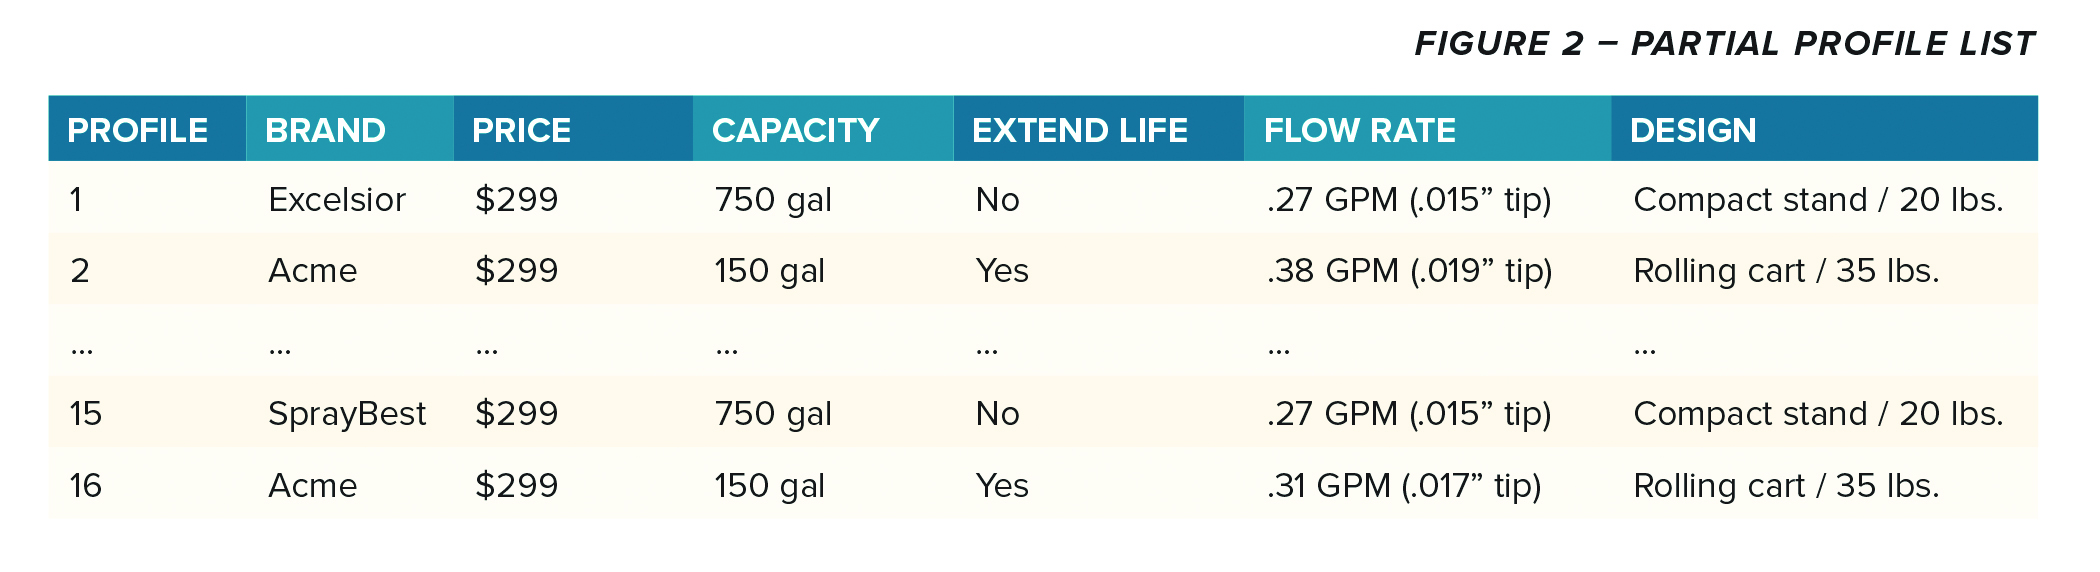
Specialized software was used to create a balanced (or “orthogonal”) design using 16 profiles; a partial list is shown in Figure 2. For sample efficiency, each respondent evaluated eight of the 16 profiles, and the overall design systematically balanced all attributes. This approach is sometimes called a “fractional factorial” design, in which only a managed subset of all possible combinations is presented while maintaining statistical validity. A total sample of 600 respondents was used, but since each respondent only saw half of the profiles, the effective sample size was 300. Note also how some combinations deliberately challenge conventional expectations—for instance, profile #1 has a high capacity but a low price—enabling measurement of trade-offs between seemingly contradictory benefits.
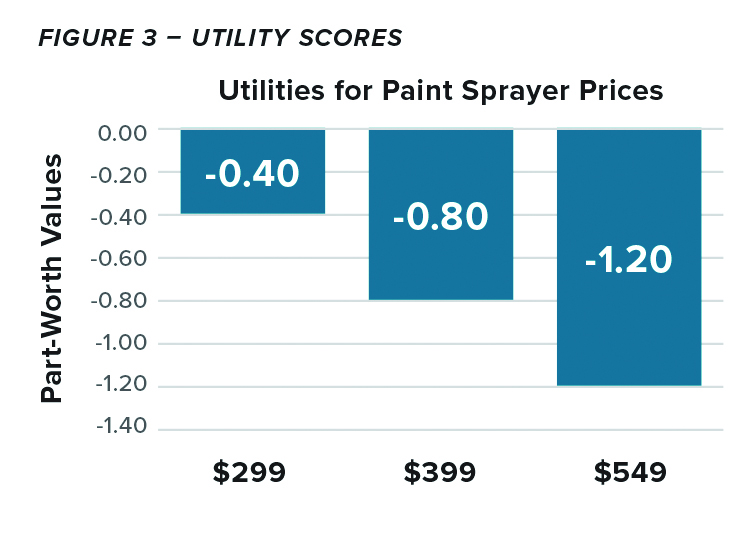
Figure 3 shows the utility scores just for the price attribute. The results show a clear negative relationship: preference decreases as price increases. For each $100 increase in price, there is a nearly identical decrease in utility (approximately -0.4 units per increment). From this, we see that consumers are linearly sensitive to price from $299 to $549.
Figure 3 – Utility Scores
Importance ratings in conjoint analysis are then derived by calculating the range between the highest and lowest utility scores within each attribute, then expressing that range as a percentage of the sum of all attribute ranges. This transformation converts the utility values into percentages (that sum to 100%), allowing marketers and product developers to easily understand the influence that each attribute has. From our real-world example in Figure 4, you can see that sprayer lifespan is the most important attribute, then price, and then the ability to extend the sprayer’s life with a repair plan.
Figure 4 – Importance Ratings
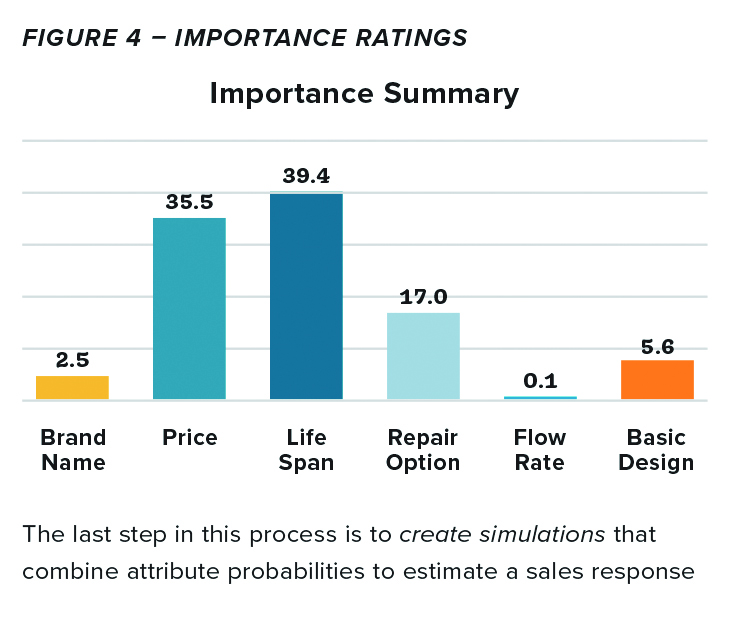
The last step in this process is to create simulations that combine attribute probabilities to estimate a sales response (i.e., intent to buy), and then forecast market share. This allows marketers to test configurations, competitive scenarios, price changes, and include a profitability variable. By incorporating additional factors like awareness, distribution, and purchase intent, simulations can be calibrated to reflect market conditions, providing very accurate predictions prior to product launch.
Wrap-Up
We hope that you now have a better appreciation for what conjoint analysis can do. Qualitative research and quantitative conjoint analysis form a powerful partnership for understanding consumer choice behavior. The context from qualitative research ensures that conjoint studies drill down into what matters—using terminology that consumers can easily understand. Conjoint then delivers precise measurement for confident business decisions. Together, they can transform consumer understanding into concrete product strategies!
Glossary of Common Conjoint Analysis Terms
| Term | Definition |
| Adaptive Conjoint Analysis | A computerized conjoint methodology that adapts questions based on a respondent’s previous answers, allowing for the evaluation of many attributes while reducing respondent fatigue. |
| Attribute | A characteristic or feature of a product or service that can vary (e.g., brand, price, color, size). These are the dimensions that consumers evaluate when making choice decisions, also called “factors.” |
| Choice-Based Conjoint | A type of conjoint analysis where respondents choose from sets of complete product profiles, mimicking real-world shopping behavior. CBC is the most common form of conjoint analysis. |
| Fractional Factorial Design | An experimental design technique that tests only a subset of all possible attribute level combinations while maintaining statistical validity, making conjoint studies more efficient. |
| Full Profile Conjoint | A traditional conjoint method in which respondents evaluate complete product profiles (showing all attributes) typically by rating or ranking them. |
| Holdout Task | A choice task included in a conjoint study but not used for model estimation; instead, it’s used to validate the model’s predictive accuracy. This is often a full concept used to calibrate the data. |
| Importance Score | A measure of how much influence an attribute has on consumer choices, calculated from the range of utilities within an attribute divided by the sum of utility ranges across all attributes. |
| Interaction Effect | When the preference pattern for an attribute depends on another attribute, indicating a lack of independence between them. This can confound the modeling process. |
| Level | A specific discrete value that an attribute can take (e.g., $99, $129, and $159 could be price levels). Levels must be mutually exclusive within an attribute (factor). |
| Main Effect | The direct, independent influence that an attribute level has on consumer preference, without considering interactions with other attributes. |
| Market Simulator | A tool that uses conjoint results to predict market share and preference for different product configurations, allowing for “what if” scenario testing. |
| MaxDiff (Maximum Difference Scaling) | A specialized form of conjoint that measures preference or importance by asking respondents to select the best and worst items from a series of sets, providing highly discriminating results. |
| Menu-Based Conjoint | A conjoint approach that allows respondents to build their ideal product by selecting features from a menu, similar to configuring a car or computer online. |
| Orthogonal Design | A statistical design approach that ensures attribute levels are uncorrelated across profiles, maximizing the information obtained from each respondent. |
| Profile (Concept) | A specific combination of attribute levels representing a potential product or service that respondents evaluate during a conjoint study. “Profile” is another way to describe a “concept.” |
| Prohibitions | Restrictions in the experimental design that prevent unrealistic or impossible attribute level combinations from appearing in the study (e.g., a budget product with premium features). |
| Utility (or Part-Worth) | A numerical value representing the relative desirability or preference for a specific attribute level. Higher utility values indicate greater preference. |
| Utility Function | The mathematical relationship between attribute levels and consumer preference, which can be linear (e.g., price) or non-linear (e.g., performance features or brand name). |