

 By Elissa Moses
CEO
BrainGroup Global
Westport, Connecticut
moses@braingroupglobal.com
 Peter Hartzbech
Founder and CEO
iMotions
Copenhagen, Denmark
peter.hartzbech@imotions.com
In this age of advanced AI methods, the qualitative research industry is exploring new emotional response tools that can enhance understanding of consumer reactions and assist in identifying and communicating leverageable insights. In this respect, some of the new, emotional measurement tools enable qualitative research to enter a “zone of deeper understanding” in the form of simultaneous, unspoken, emotional measurements that are overlayed on top of interviews and combined across sessions to enable semi-quantitative analysis. This is especially useful when exploring reactions to all types of stimuli including new and alternative products, advertising, packaging, concepts, and more.
New AI-Driven Methods for Qualitative Researchers
The two AI methods spotlighted in this article are voice metrics and facial expression analysis. Both are rooted in psychology and behavioral science with academic foundations for validation.
Voice Analysis
Voice analysis is a natural fit for qualitative research, offering another way to understand vocal communication. Beyond the intended meaning of the words chosen by participants to answer questions and the moderator’s reading of their facial and body language, the analysis of the actual voice reveals emotions and the degree of emotion on any given topic.
There are three types of basic measures that can be leveraged in voice analysis. The first class of metrics is referred to as prosody. Prosodic elements of speech include characteristics of speech delivery including fundamental frequency, speaking rate, intonation, and loudness. The second group of metrics relates to emotional expression and can measure arousal, excitement (activation), confidence, fear, or uncertainty (dominance), and positive or negative response (valence). This system also captures specific emotions including happy, sad, and angry, which can be especially useful when deciphering participant reactions to sensitive and controversial subjects such as politics and public policy.
By running qualitative audio recordings through AI software during or after sessions, the vocal responses to stimuli, specific topics, and questions can be quickly calculated and displayed, providing additional knowledge for in-depth understanding. This overlay has the potential to change the direction of analysis or even overarching conclusions.
Facial Expression Analysis
Facial expression analysis uses objective, simultaneous coding of participants’ facial expressions to help qualitative researchers reveal new insights regarding how consumers react toward stimuli or topics. In this way, specific emotions such as happiness, sadness, and anger, etc. can be captured in the fleeting expressions, gestures, glances, and silent cues that words alone often may not necessarily reveal. Sometimes emotional reactions are simply unrecognized or too difficult to put into words. We also know that a hard-to-escape bias of qualitative research is in the form of social deception when participants are internally driven to exaggerate, misconstrue, or camouflage their true feelings out of concern for being accepted or making the right impression.
The overwhelming urge to please or fit in can lead to answering questions in a way that is deemed to be most socially acceptable, particularly when reacting to test stimuli.1 This is the realm of “little white lies” when participants tell moderators that they like brands, products, flavors, policies, ads, and political candidates that actually may not be very personally appealing. The use of facial expression analysis becomes a qualitative work-around for possible exaggeration, obfuscation, and fabrication.
Whether testing digital interfaces or creative content, facial expression analysis empowers us to read the emotions of subjects in real-time without the bias of self-editing.
A “Qualitative Plus Quantitative” Perspective
With these new tools, qualitative researchers have access to new types of emotional data that can be analyzed and combined at scale across groups and IDIs with incredible speed. This applies to the verbal and visual facial response output from qualitative sessions which can be mined for insight beyond the participants’ literal answers to questions. With new, easy forms of “qualitative plus (semi)-quantitative analysis,” insights are enriched, and qualitative researchers have the opportunity to provide a deeper analysis regarding how people respond. In essence, AI technology affords new levels of qualitative understanding with the premise that some human truths, especially emotional ones, are not often easily detectable or accurately measurable. This new method can reveal the feelings behind the masks so many of us wear in everyday interactions.
Below we explore an example of how AI-enabled voice and facial expression analysis works, using a case study of focus groups conducted to gauge reactions to the 2026 Super Bowl ads. The methodology had participants view stimuli one ad at a time as a group and discuss their reactions right after exposure to each one. Session recordings were then immediately processed for voice and facial expression patterns, aggregated to reveal emotional response trends across participants. This gave rise to understanding the patterns of emotional response, excitement, positivity, and conviction. It proved to be valuable to have these tools differentiate between options and provide a valid foundation for ranking. As a result of the AI-powered analysis, the qualitative moderator gains the ability to provide a much greater depth and breadth of perspective as illustrated below.
The 2026 Super Bowl Ads: A Case Study
First, the Focus Groups
The week after the Super Bowl, we conducted three online focus groups, with six to eight participants each, to evaluate reactions to a subset of seven Super Bowl commercials based on their high and low rankings in the USA Today Ad Meter Poll out of 54 ads ranked.2 Selection of ads to be explored in our study was based on the goal of providing a range from top performers in Ad Meter, to moderate high, moderate low, and lowest. The ads chosen for our study and their rankings were:
- Budweiser – “American Icons” (#1). Watch here

- Dunkin’ – “Good Will Dunkin’” (#4). Watch here

- Xfinity – “Jurassic Park…Works” (#6). Watch here

- Pringles – “Pringleleo” (#22). Watch here

- Squarespace – “Unavailable” (#39). Watch here

- Svedka – “Shake Your Boots Off” (#53). Watch here

- Coinbase – “Everybody Coinbase” (#54). Watch here

The group discussions were clearly insightful in helping to understand the Ad Meter rankings. The highest-ranking Budweiser ad was perceived to be touching and iconic, with a great story and an element of visual surprise. The Dunkin’ ad, also in the top five, was nostalgic and intriguing to people because it showed beloved celebrity TV sitcom characters from times past and held a lot of sentimental value. The Xfinity ad, scoring in the top 10, was confusing to many, even though some felt it was touching to see footage from the old Jurassic Park movies, reminding many of the participants of their youth. On the other hand, it was not always clear whether the ad’s purpose was to showcase the theme parks, the movies, or the Xfinity system itself.
In contrast, the upper mid-ranking Pringles ad was considered “weird.” Moreover, it was not deemed to be very appetizing as a food product. And yet, some thought it was a fun play on pop star Sabrina Carpenter’s persona.
Further, the lower ranking Squarespace ad, was considered to be just “over the top” and “odd” for most, and yet, “sort of fun to watch.” There was debate over what the brand stands for, with most associating Squarespace with website creation far more than with domain name registration, which was the focus of the ad.
Near the bottom of the list, the Svedka ad was openly disliked and considered to be using borrowed interest. This referred to the reliance on celebrity power, pop cultural references, and trending topics to attract attention. Participants relayed that there was no perceived clear message for why or how the AI robots relate to the vodka.
Finally, the lowest ranked Coinbase ad was conjectured to be a joke. Some asserted the ad budget was presumably blown on expensive song rights for the old tune that “maybe means something to Millennials” but likely left no money for ad visuals. In essence, the ad was perceived as unfinished, ineffective, and not particularly relevant to Coinbase.
Second, the Emotion Metric Data Analysis After the Focus Groups
Following the groups, the video recordings of the focus groups were run through the AI software for analysis of speech and facial expressions. The data was then delivered into charts and graphs for easy review.
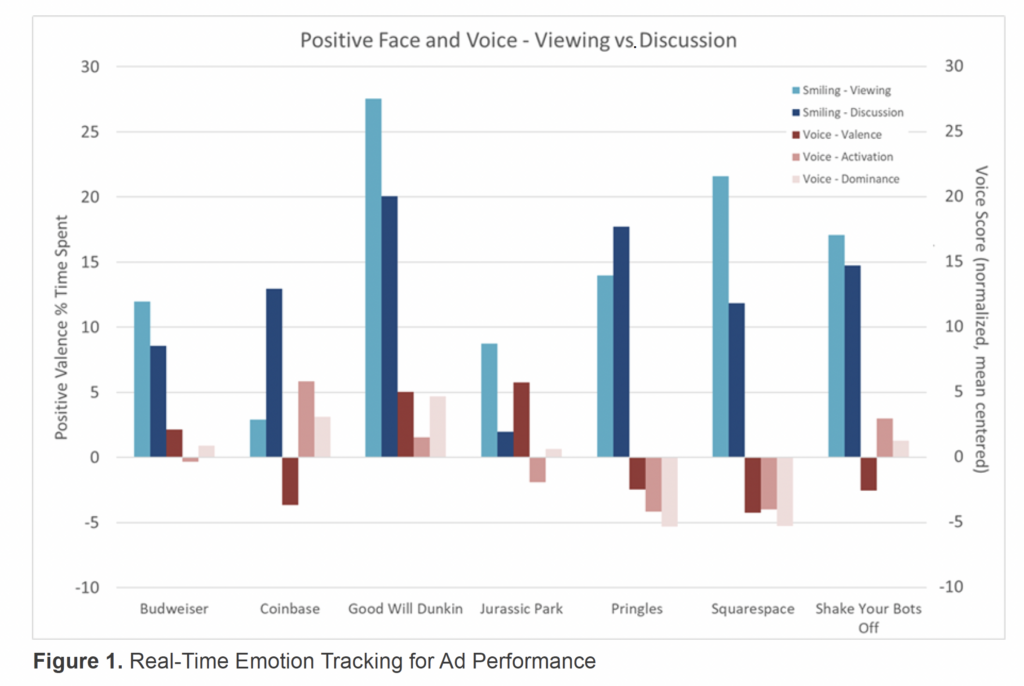
Starting with the chart “Positive Face and Voice – Viewing vs Discussion” (Figure 1), based on the emotion metrics and some of the discussions, it is clear to see a somewhat different and more nuanced story than what the Ad Meter rankings told us.
A quick glance reveals new insights into the ads’ receptivity. Budweiser was ranked as the #1 ad, but it was not nearly as engaging as the Dunkin’ ad. And while the Svedka Vodka “Shake Your Bots Off” and Coinbase “Everybody Coinbase” ads were not very likeable, the participants found them great fun to talk about—in essence, they were ads folks “loved to hate.” This demonstrates the value of combining qualitative feedback with emotional response measurements—the layering provides a window into meaning that neither method alone can provide.
Providing the broad overview for each ad, a couple of revelations also become clear.
- The objectve, emotional experience of a stimuli may vary remarkably from the feelings expressed to describing evoked reactions, and sometimes the two resulting data sets lead to conflicting yet illuminating conclusions.
- A rational response to stimuli, such as the praise for the Budweiser ad and ratings that positioned it as #1 may be exaggerated or repressing conflicting feelings, as captured by the nonverbal emotional response metrics.
While the conversational responses to the Budweiser and Dunkin’ ads were both positive, the AI emotion metrics determined that the excitement and conviction surrounding the Dunkin’ ad surpassed those for the Budweiser ad, indicating that the Dunkin’ ad is the “better of the two,” contrary to Ad Meter’s Super Bowl ratings. Being “better” is in the context of Super Bowl ads being exciting, attention-grabbing, and engaging. In the groups, the participants could not stop talking about the Dunkin’ ad and relaying personal memories about the celebrity characters it showcased. The participants were obviously excited and engaged. Hence, this type of analysis can uncover new insights, especially when, as in this case, the spoken words do not line up with the emotions that have been expressed nonverbally.
To examine more closely, here is a brief explanation of the metrics displayed below. The bars are color-coded to reveal the uncontrolled reactions to the ads both while viewing them and then while discussing them using time codes to link to participant activities. In this simple analysis, we use smiling as an indicator of likeability. The voice metrics selected include “valence” which is positivity and negativity, “activation” which signals excitement, and “dominance” which refers to intensity or conviction.
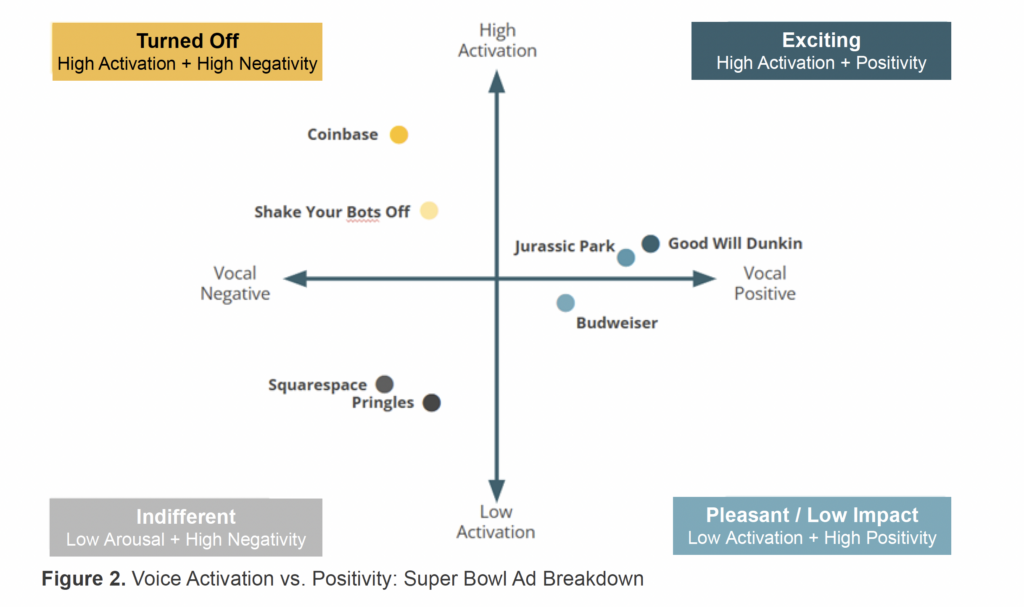
 Here is another way to chart and evaluate the AI emotion-driven data. The graph in Figure 2 plots voice activation (high or low) versus positive or negative emotional response. Through this lens, Dunkin’ is again the most favorable ad followed by Xfinity’s “Jurassic Park.” Budweiser retreats to a more modest position in the lower right-hand quadrant evoking less energy and less positivity.
With only conversation, it would not be possible to create this type of unbiased rank order or determine where the dominating sentiment lies.
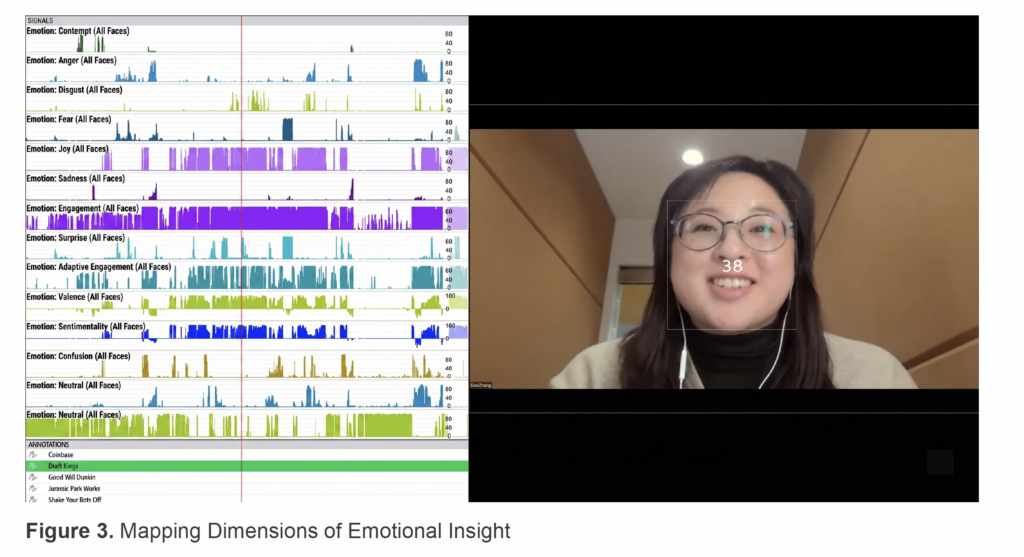
 It should also be noted that voice analysis and facial expression analysis metrics provide an array of measures to choose from depending upon the objectives of the analysis. While this analysis, for the sake of example, does not include every measure possible, there are actually about 30 metrics in total, which can cover a range from typical emotional expressions to subtle facial movements indicating nuanced and unstated reactions such as valence (positive/negative), contempt, anger, disgust, fear, joy, sadness, confusion, and surprise. Moreover, these discrete measures can be viewed in the context of response to all types of stimuli or discussion segments on a topic by relevance. They can also be examined for an individual, a single group, or across multiple groups.
In the analysis, the layered emotional feedback is usually examined in several ways. For instance, this real time video clip captures both group and individual emotion from facial emotion while discussing the Budweiser ad.
Another way to capture group sentiment is to look at the pattern of emotions, such as smile and valence, as the ad is played. In this analysis of the Dunkin’ ad, the positive feelings escalate throughout the ad.
Comparing Verbal Qualitative Feedback with Emotion Metrics
When verbal feedback and emotional-response metrics differ, researchers should not assume one is right and the other is wrong. Often, the difference is the insight. What people say reflects conscious judgment: what they believe, how they interpret a message, and what they feel comfortable expressing. Physiological measures capture involuntary, moment-to-moment signals of attention and emotional arousal researchers may not fully be able to notice or articulate.
Experienced human analysis is essential. Researchers examine the full pattern: what occurred in the stimulus when reactions changed, what participants said, the influence of brand familiarity or social context, and measures such as recall, choice, or behavioral intent. See Figure 3 for a glimpse of the output of mapped dimensions of emotional insight.
 For example, participants may prefer one advertisement because it feels familiar, is emotionally resonant, and is aligned with brand expectations. Another may generate stronger immediate attention or emotional engagement at key moments. These findings do not cancel each other out; they may show that the first ad reinforces established brand equity, while the second is more likely to stand out, be remembered, or encourage action.
Clients should receive the two types of findings, with a clear interpretation of any tension or harmony and what it means for optimizing creative and setting realistic expectations.
A New Frontier
In a world increasingly overwhelmed with synthetic voices and AI-driven automation, our value as qualitative researchers who are “human truth seekers” is evolving and expanding—not eroding. By bridging the gap between physiological emotion feedback and human narrative, we are creating a future where qualitative research can be powered by a deeper, scientifically validated framework for understanding emotional response.
This is a new frontier for qualitative researchers beyond anything we might have imagined before AI. But it promises to become the new normal, as it proves itself to expand the value for marketing insight and decision-making by understanding how people react emotionally in the context of how they verbally explain their reactions and thought processes.
References
(1) José Patricio Bispo Júnior, “Social desirability bias in qualitative health research,” Rev Saude Publica, (2022): 56:101, https://pmc.ncbi.nlm.nih.gov/articles/PMC9749714/
(2) Gabe Lacques, “Budweiser Super Bowl commercial unites Clydesdale and bald eagle in USA epic,” USA TODAY, (2026), https://www.usatoday.com/story/sports/ad-meter/2026/02/08/budweiser-super-bowl-commercial-clydesdale-bald-eagle-ad/88580436007/