


By Robert W. Walker
CEO
Surveys & Forecasts, LLC
Norwalk, Connecticut
rww@safllc.com
For qualitative researchers, sales forecasting can feel far outside of traditional boundaries. Qualitative researchers are accustomed to discussing unmet needs, emotional motivations, purchase drivers, and positioning opportunities. These skills don’t usually transfer over to discussions of unit volume or market share. Yet the foundations of a sales forecast come directly from the kinds of questions qualitative researchers are trained to explore. In fact, the core components of a sales forecast are a direct reflection of the customer’s journey (i.e., the drivers of initial purchase, repeat purchase, loyalty, and purchase frequency). All of these should be quite familiar to most qualitative researchers.
Sales forecasts are not limited to new product launches. They may be developed before launch to estimate initial market potential or used throughout the life of an existing product, brand, or product line to support ongoing planning and decision-making. The available inputs differ accordingly: established products can draw on actual sales and marketplace data, while new product forecasts rely more heavily on research, analogous products, category benchmarks, and assumptions about expected market behavior.
Overview: Research That Precedes the Forecast
Before a sales forecast can be constructed, researchers must first estimate the behavioral inputs that ultimately drive the overall estimate. These inputs rarely originate from a single study. Rather, they are assembled from qualitative exploration, quantitative studies, and external data sources gathered during the product development process. Yet even the most sophisticated forecasting tools cannot account for all unknowns. Bottom line: the overarching objective is to build a disciplined, research-based estimate that can truly guide the critical business decision—whether or not to launch.
In many forecasting exercises, the process begins with concept research designed to estimate product appeal and initial purchase intent. Early-stage qualitative work helps refine the positioning, identify unmet needs, clarify product relevance, and, in categories where functional performance is central—for example, household cleaning or pain relief—determine whether the proposed product or service solves a meaningful problem. This work shapes the product concept itself long before volumetric forecasting begins.
Once the concept has been sufficiently refined, quantitative concept testing is often used to estimate purchase intent, a key evaluative measure. Measures such as uniqueness, superiority, value, relevance, and anticipated purchase frequency further help researchers understand not only whether customers find the idea appealing, but also how strongly the product fits within known category behavior.
Appeal alone, however, is not enough. A concept may generate strong initial interest but offer little differentiation from existing alternatives. Conversely, a product with only moderate purchase intent may exhibit unusually strong uniqueness or superiority that ultimately supports stronger in-market performance. For this reason, experienced forecasters typically interpret purchase intent in combination with diagnostic measures such as perceived differentiation, superiority over current options, relevance, the extent to which the concept addresses unmet needs, and anticipated frequency of use.
Purchase frequency is particularly important, because it directly influences annualized volume. A product purchased weekly behaves very differently from one purchased once or twice per year, even if overall concept appeal is similar. Understanding how frequently the product is likely to be used, replenished, or repurchased becomes essential when translating concept appeal into a Year 1 sales estimate.
Figure 1 illustrates the primary streams of research that typically contribute to a forecast, including qualitative research, quantitative concept testing, product evaluation research, and external validation sources such as scanner data, known media spending, and available benchmarks.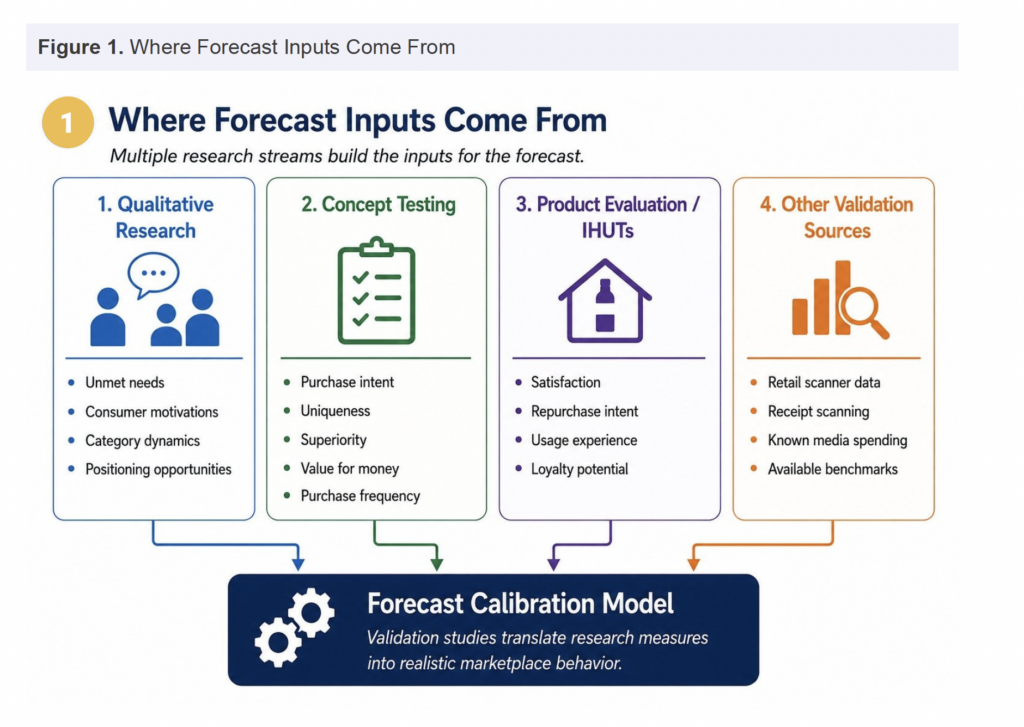
Idealized Research Conditions Versus Marketplace Reality
One of the most important principles in forecasting is recognizing that research inputs are collected under idealized conditions. In a concept test (typically used to capture future purchase intent), every respondent is shown an idea as a candidate for purchase. This, in turn, means that awareness is effectively 100 percent against a perfect target audience. Distribution is identically implied: the product is readily available, and respondents need not search for it. Issues of competitive clutter, retail execution, advertising delivery, and marketplace distractions are all absent.
As a result, concept testing measures a buyer’s response under perfectly controlled conditions. The concept test is best understood as a measure of potential appeal, not a literal estimate of what will happen in-market once awareness, distribution, competitive response, and execution realities kick in.
The same principle applies to product evaluation research—either central location testing (CLTs) or an in-home use test (IHUTs). Sensory testing may also be used to provide additional product performance metrics. These studies are used to estimate concept-product fit and first repeat purchase potential. Diagnostics (e.g., perceived superiority or uniqueness) also shape ongoing loyalty measures based on the customer’s direct product experience. Again, trial in these test environments is highly controlled: customers are presented with the product for evaluation, rather than discovering it naturally through advertising, distribution, merchandising, or word of mouth. Repurchase intent therefore reflects satisfaction after a guaranteed trial exposure experience vs. organic marketplace adoption.
The forecast then translates prospective customer reactions into realistic expectations by accounting for awareness, distribution, competitive intensity, purchase cycles, pricing, and behavioral attrition over time. Figure 2 summarizes these conversions, from idealized research conditions to marketplace reality.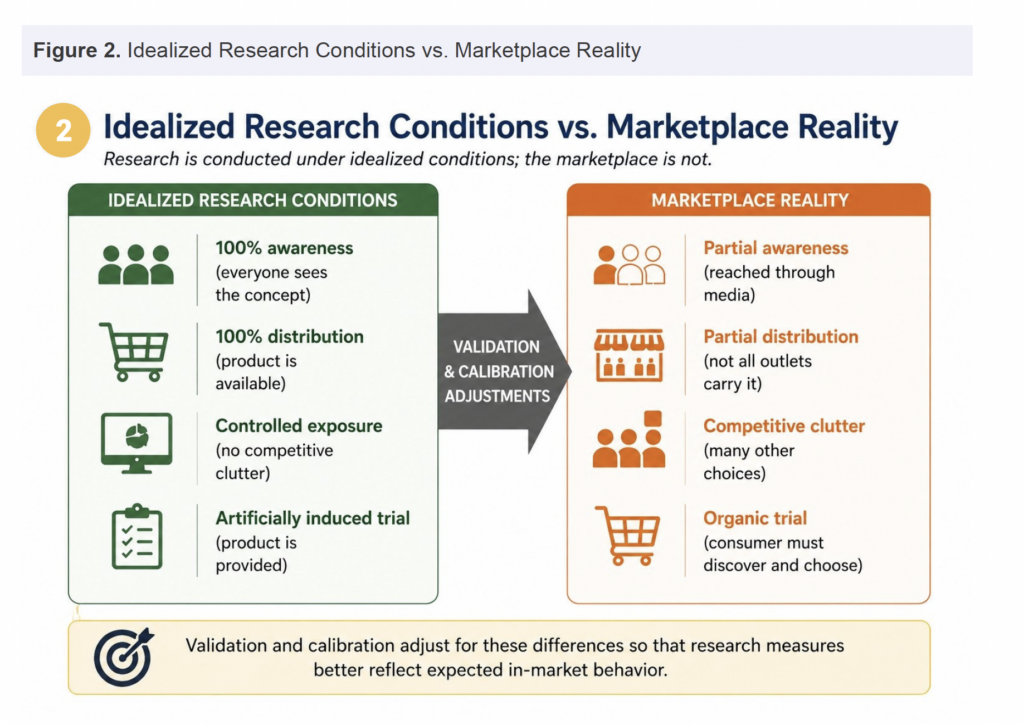
Converting Research Measures into Forecast Inputs
The next challenge is to convert our evaluative measures into likely in-market behavior. Over many decades, researchers and forecasters have conducted validation studies comparing research measures against actual in-market outcomes. These studies examine the relationship between purchase intent scores, concept evaluations, satisfaction measures, trial estimates, repeat intent, and eventual marketplace performance after launch. Over time, these comparisons have produced calibration models that help translate research findings into realistic behavioral expectations.
This is why many forecasting systems apply weighted adjustments to purchase intent (and other) measures rather than relying on top box scores alone (i.e., “definitely will buy”).
Customers often overstate positive intentions in research settings, particularly when evaluating new ideas under idealized conditions. At the same time, some respondents expressing low purchase likelihood may still purchase once advertising support, merchandising, social influence, and retail visibility are considered.
Importantly, calibration approaches differ by category. Consumer packaged goods and frequently purchased services typically have short purchase cycles, allowing trial and repeat behavior to emerge more quickly than durable goods such as appliances, automobiles, or mattresses. These latter categories behave very differently, and replacement cycles can extend years into the future: a customer may express strong interest in a new appliance yet have no immediate plan to buy.
For this reason, experienced forecasters rarely apply a single universal standard across all categories. The relationship between research measures and marketplace behavior must be interpreted within the known realities of the category. Figure 3 illustrates a commonly used approach for translating stated purchase intent into a weighted trial estimate which is then used as an input into the sales forecast.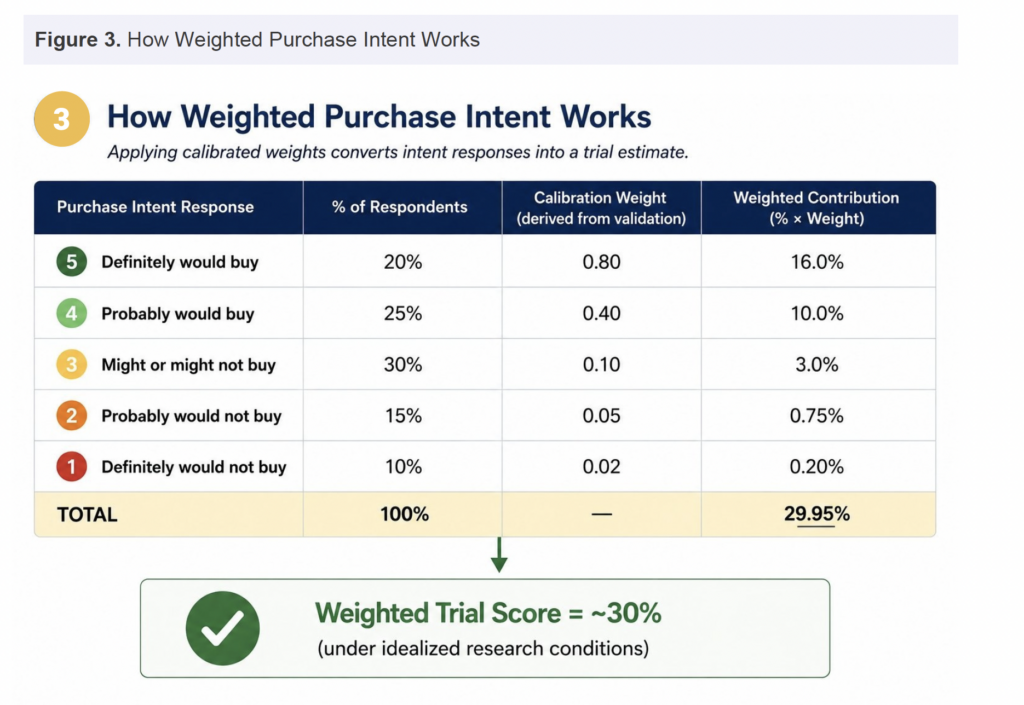
Building a Year 1 Forecast
Once research inputs have been calibrated against expected marketplace behavior, they are entered into the forecast process. Most Year 1 consumer goods forecasts are built from a relatively standard sequence of behavioral inputs. After the estimated weighted trial score has been derived, that estimate is then multiplied by the number of people who are considered to be in the target (for example, all women ages 21-54). This figure is called the “interested universe” of potential buyers. From here, additional adjustments are made to estimate expected awareness and distribution levels (typically entered by month) until the end of the first year of the launch.
The model then estimates trial volume (i.e., first purchase). In short purchase cycle categories, this behavior may occur soon after launch, particularly when advertising support and retail availability are strong. The next stage involves estimates of timing and magnitude of repeat purchases. Customers often require time to consume the product, evaluate their satisfaction, and then re-enter the category before making another purchase. As a result, many forecasting models separately estimate the interval between initial purchase and first repeat purchase. As the months progress, the model builds cumulative volume.
Beyond first repeat, the model estimates repeat purchase volume and ongoing loyalty levels. These measures are often informed through product evaluation studies as noted above. Because these studies assess actual product experience, they offer robust indicators of longer-term buying behavior.
Taken together, these inputs form a behavioral progression from awareness, to trial, to repeat purchase, and eventual steady-state loyalty. The forecast becomes less of an abstract mathematical exercise and more of a modeled representation of how customers will adopt and continue using a product over time.
Hypothetical Forecast: Acme Fruit Juice Company
Acme Fruit Juice Company. Acme is preparing to launch a fortified orange juice with extra pulp. The product is positioned as a premium alternative within the refrigerated juice category and is expected to compete primarily on superior taste and health benefits.
Early-stage qualitative research suggested that customers viewed the additional pulp and fortification as both distinctive and relevant, particularly among heavier orange juice users and households seeking products perceived as more natural or functional. Acme then conducted a quantitative concept test using a five-point purchase intent scale. Rather than relying exclusively on the percentage of respondents indicating they “definitely will buy” the company applied calibrated weights to each response category based on historical validation work linking stated intent to actual marketplace behavior. Let’s assume the following:
- We conduct a concept test with the following response distribution: 20 percent definitely would buy (also called “top box”), 25 percent probably would buy, 30 percent might or might not buy, 15 percent probably would not buy, and 10 percent definitely would not buy. Acme applied category weights of .80, .40, .10, .05, and .02 respectively to those groups. Rounded, this produced a 30 percent weighted trial estimate—that is, we expect that 30 percent of the target audience will try the new product.
- The company’s marketing plan projects that advertising support would generate 40 percent awareness by the end of Year 1, and distribution is expected to reach 75 percent of all grocery and mass merchandiser stores (the brand’s primary channels).
- The concept also scored slightly above known category norms on measures of uniqueness and perceived superiority. Based on prior validation work in the refrigerated juice category, management concluded that these scores justified slightly stronger-than-average trial conversion expectations relative to their other products and line extensions.
- Product evaluation research and Acme’s category knowledge suggested that a 70 percent first repeat rate (i.e., after initial trial) and a repeat volume factor of 1.0 (i.e., average volume) represented realistic assumptions for the brand’s intro year.
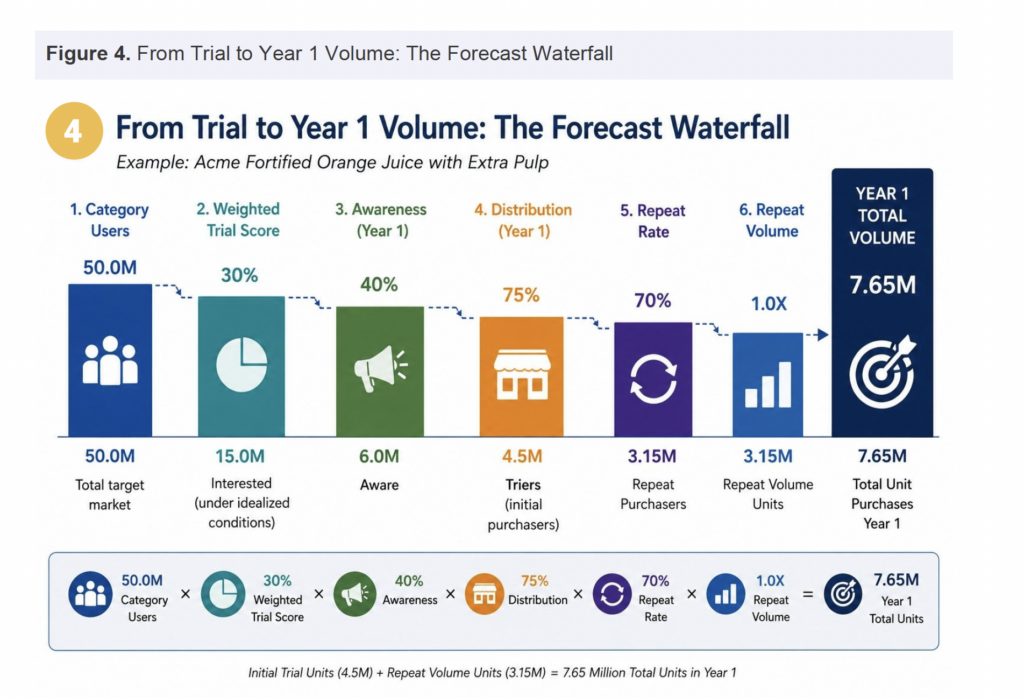
Using a simplified behavioral model, the Year 1 forecast might therefore be structured as follows: a base target market of 50 million category users, weighted trial of 30 percent, 40 percent awareness, and 75 percent distribution. This produces an effective trial estimate of 4.5 million “triers.”
Applying our repeat assumptions, 4.5 million triers x 70 percent repeat rate = 3.2 million repeat buyers. Assuming a repeat volume factor of 1.0 (i.e., average consumption volume) during Year 1, it would produce 3.2 million repeat volume units (that is, separate from initial trial units).
Combining the initial trial volume with repeat volume yields a Year 1 estimate of approximately 7.7 million units.
In practice, a fully developed forecast could also incorporate adjustments for seasonality, specific types of advertising or promotional support, social media, retailer execution variability, and competitive response. Nonetheless, this (very) simplified example illustrates how concept appeal, awareness, distribution, trial, repeat behavior, and loyalty assumptions combine to form the backbone of a consumer goods forecast. Figure 4 presents this Acme example as a forecast waterfall.
 Scenario Planning & Sensitivity Analysis
A forecast should not exclusively rest on a single deterministic number. Instead, experienced forecasters will typically create multiple scenarios that reflect different assumptions about awareness, distribution, trial conversion, repeat purchase, and competitive response.
Testing different scenarios (also called “sensitivity analysis”) helps identify which variables exert more or less influence on the final forecast. In many consumer categories, relatively small shifts in repeat purchase behavior or distribution levels can produce large changes in projected volume. Understanding these effects allows a client to focus resources where they matter most. Scenario modeling also strengthens credibility because it demonstrates that uncertainty has been tested and evaluated rather than ignored.
Sales Forecast Flow: From Concept Exposure to Year 1 Forecast
The concluding Sales Forecast Flow visual (Figure 5) brings together the full sequence described above, from concept exposure and calibration through awareness, distribution, trial, first repeat, repeat volume, and the Year 1 sales forecast. 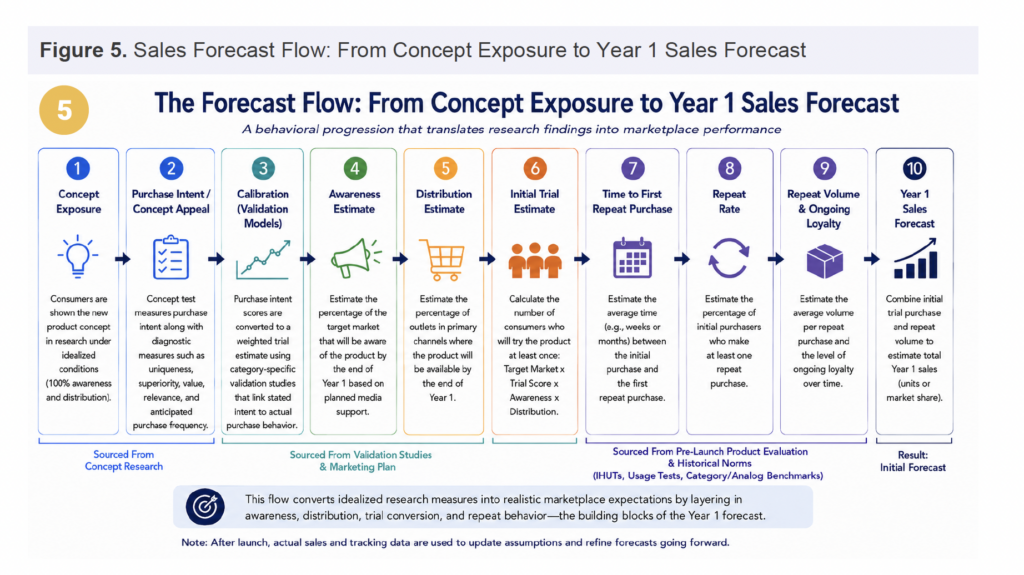
Using Forecasts in Practice
A forecast is most meaningful when fully integrated into new business planning. Once developed, a forecast informs all core business functions: production schedules, inventory planning, marketing support levels, sales targets, and even retailer negotiations.
Importantly, forecasts should not remain static. As actual sales data emerge, assumptions should be revisited and refined, and new estimates generated. Because the underlying logic of the forecast is already understood, variance analysis (i.e., “Are we coming in too low?”) becomes diagnostic rather than defensive. Teams can identify whether awareness, distribution, trial conversion, or repeat purchase assumptions diverged from expectations and can pivot accordingly.
For qualitative researchers, especially those with deep category knowledge, participation in forecasting expands their advisory role within the client’s organization. It demonstrates that behavioral understanding does not simply explain the marketplace—it helps shape forecast inputs and the business decisions within it.